

Redundancy is the most satisfying arithmetic in reliability engineering. Put two units in parallel, multiply two small probabilities together, and a system that could not meet its availability target now clears it comfortably. The block diagram says so, and the block diagram is not lying.
Then somebody walks to the cabinet. Both units draw from the same converter, breathe the same air through the same filter, and were installed on the same afternoon by the same technician from the same delivery box. The redundant pair is one blown supply away from being a single unit. The diagram was answering a question about a model, and the model did not contain the rack.
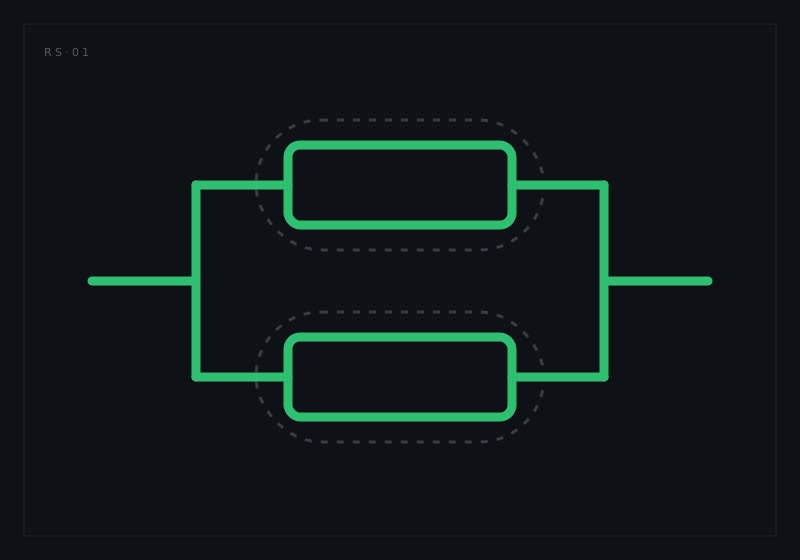
What a parallel block actually claims
A reliability block diagram is a logical model of success paths rather than a picture of the equipment. IEC 61078:2016 sets out how they are built and how availability, reliability and failure frequency are computed from them. Nothing in the notation describes cables, cabinets or shifts, and nothing was ever meant to.
Two blocks in parallel therefore assert two separate things. The first is structural and usually true: the system continues if either channel works. The second is probabilistic and often unexamined: the two channels fail independently, so the chance of losing both is the product of two small numbers rather than something much larger.
That second claim is where the entire benefit lives. Multiplying independent probabilities is what turns two ordinary units into an extraordinary pair. If independence is only partly true, the multiplication is only partly earned, and the diagram gives no visual hint about which case you are in. Readers of fault trees know this shape already: a parallel path in an RBD is the same assertion an AND gate makes, expressed in a different notation.
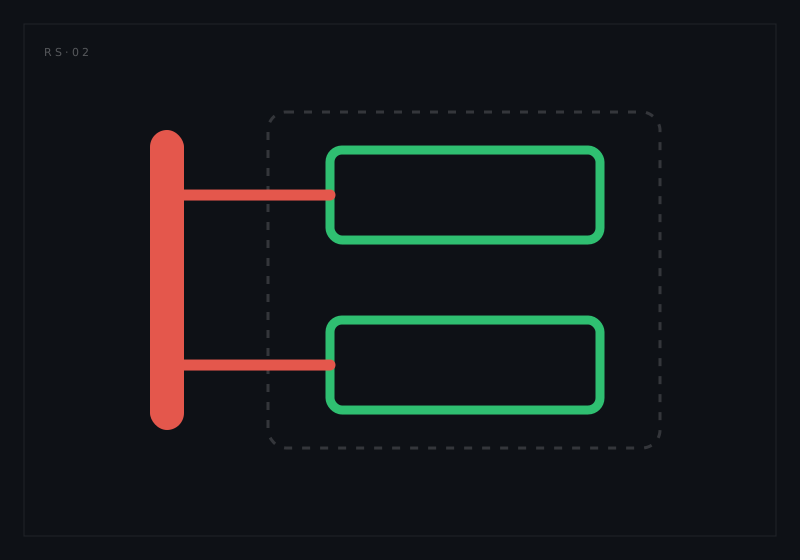
What the diagram cannot see
Walk any real installation and the shared things accumulate faster than anyone expects.
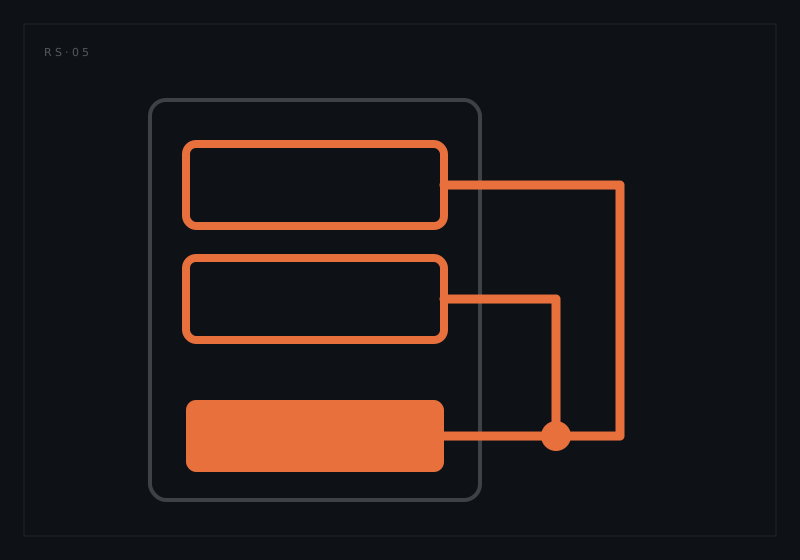
There is the power path: two units, one converter, one breaker, one feed. There is the cooling path: one fan tray, one filter, one duct, so a blocked intake raises both units past their derating limits together. There is the environment they share simply by being in one cabinet, which means one vibration source, one humidity excursion, one lightning transient on the same earth.
Then there are the shared things with no physical presence at all. Both channels usually carry the same build lot, so a defective batch of capacitors is in both. Both run the same firmware, so a fault triggered by a specific input sequence is not redundant in any useful sense; it is one bug installed twice. Both were configured from the same file, calibrated with the same instrument, and tested against the same procedure that missed the same thing.
The one that is most often left out of the analysis is maintenance. The same person services both channels, in the same visit, using the same procedure, having formed the same misunderstanding of it. Redundancy also invites deferred repair, which is its quietest failure mode: a pair with one channel already dead is a single channel that still looks like a pair on the availability report.
Putting a number on the doubt
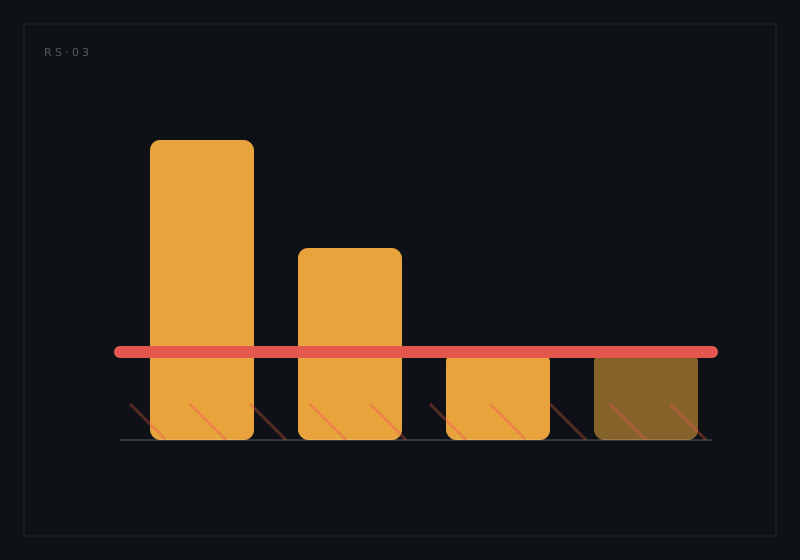
The discipline's standard answer to this is the beta factor. A proportion of a channel's failure rate, written as beta, is treated as common cause: those failures take both channels at once. IEC 61508-6 supplies a scored checklist for arriving at a value, working through separation, diversity, complexity, procedures, competence and environmental control, with the resulting beta typically landing somewhere between a fraction of a per cent and around ten per cent. The common-cause contribution is then that fraction of the single-channel rate, added alongside the independent term.
The arithmetic consequence is worth stating plainly, because it changes what engineering effort is worth spending. The independent term falls as you improve the channels, add another one, or repair faster. The common-cause term does not. It is a floor set by how well separated the channels are, and beyond a certain point it dominates the result completely.
So a design conversation that starts with "can we buy a more reliable unit" is usually asking the wrong question. Below the floor, a better unit buys almost nothing measurable. Separating the two units you already have, onto different supplies, different cooling paths, different maintenance visits, moves the floor itself. That is what the beta checklist is really scoring.
The honest caveat: beta is a judgement dressed as a coefficient. Two competent engineers scoring the same architecture can land a factor of two apart, and the result inherits that uncertainty. Record the score sheet with the model, and the number stays reviewable even though it stays arguable.
The switch is a component too
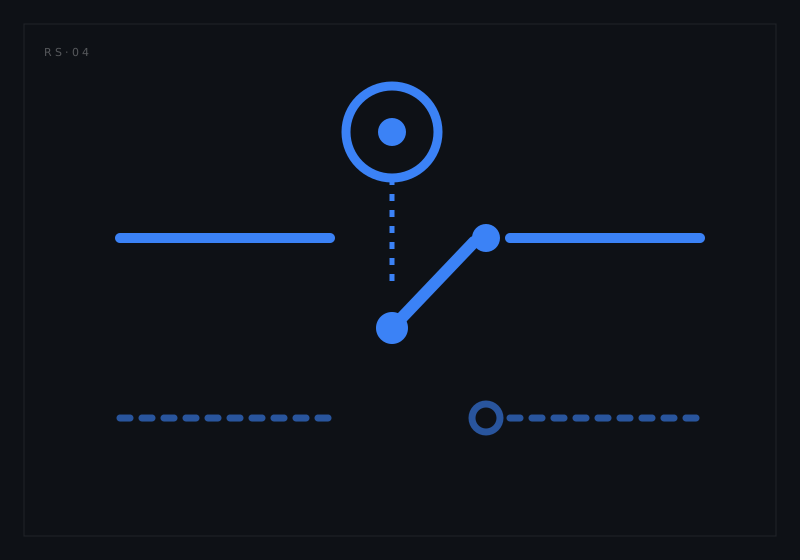
Parallel blocks assume something else that rarely gets drawn: that the system notices a failure and uses the surviving channel.
In a standby arrangement that involves real hardware and real logic. Something has to detect the failure, decide, and switch over, and each of those steps has its own failure rate. Detection is imperfect, so some fraction of failures never raises an alarm. The changeover itself can fail on demand, having sat unexercised since commissioning. In fast processes, switching that works perfectly but slowly is indistinguishable from switching that did not happen.
Undetected failures deserve particular suspicion, because they convert redundancy into its appearance. A channel that died three months ago and was never flagged has been contributing nothing since, while every availability figure has been quietly assuming otherwise. The exposure is set by the interval between proof tests, which makes that interval a design parameter rather than a maintenance detail, exactly as it is for latent failures in a fault tree.
Walking the rack
The most productive hour in any redundancy analysis is spent away from the model.
Trace each channel's power back through the cabinet until the two paths meet, and note where that happens. Do the same for cooling air, for network, for timing references and for earth. Ask who performs the maintenance, on what schedule, and whether both channels are ever open at once. Read the lot codes on the boards. Compare firmware versions. Notice which two things sit physically adjacent, because a coolant leak, a fire or a dropped tool respects proximity rather than block diagrams.
Everything found on that walk is either a correction to the model or a change to the installation, and both outcomes are wins. The result is not always separation: sometimes the right answer is to accept the shared feed, record it as a common cause with the rate it deserves, and stop claiming an availability figure the site cannot deliver. An architecture that is honestly modelled and modestly redundant is worth more than an optimistic one, because the maintenance budget built on it will survive contact with the fleet.
How RAMSynapse approaches this
An RBD is only as current as the failure rates underneath it and the architecture it claims to describe, which is why we built RAMSynapse around a registry rather than a set of files. Block rates reference the same values the prediction computes and the FMECA ranks, so a component substitution or a revised stress reprices the availability figure instead of leaving it stale in a document from last year.
Shared resources are modelled explicitly rather than living in an analyst's memory: a common supply, a common cooling path or a shared maintenance action is an object the model knows about, so the common-cause contribution appears in the result and its scoring travels with it. When the configuration changes, the affected availability numbers recompute and flag what moved.
The block diagram is a claim about the world. It is worth walking the rack to find out whether the world agrees.
Want to see an availability model that knows what its channels share? Request a walkthrough.