

Two numbers sit in every reliability programme. The contract says the equipment shall achieve an MTBF of 50,000 hours. The prediction says 52,300. Everyone in the room knows the fleet will produce neither number, and the meeting moves on anyway.
That shared, unspoken scepticism is where reliability prediction earned its bad reputation, and it comes almost entirely from asking the method for something it never offered. A prediction is not a forecast of what your fleet will do. It is an instrument for comparing design choices under a stated set of assumptions. Used that way it is among the most useful things a reliability engineer owns. Presented as a promise, it is indefensible, and the engineer who defends it that way spends credibility they will need later.
The number is not a forecast
Start with what the models contain. A part-stress prediction takes the bill of materials, assigns each part a base failure rate from a published dataset, and multiplies by factors for temperature, electrical stress, quality level, environment and packaging. Sum the parts and the assembly's failure rate falls out.
Now notice what sits inside that calculation, and what does not. Inside: part types, applied stresses, an environment category, a quality grade. Outside: your manufacturing process on the day the unit was built, the design error nobody has found yet, the counterfeit component in the supply chain, the damage done during maintenance, the operator running the box outside the profile anyone wrote down. Field returns are dominated by exactly those causes.
There is a second boundary that matters just as much. Part-stress models produce a constant failure rate: the flat middle of the bathtub. Infant mortality and wear-out sit outside the model by construction. So the number describes the intrinsic, steady-state behaviour of a population of parts, and stays quiet about most of what actually removes equipment from service.
None of this is a defect. It is a scope statement, and the handbooks write it down themselves. The trouble starts when the number leaves the analysis and travels into a proposal with the scope statement stripped off.
Why the handbooks disagree
Run one board through two methods and the answers can differ by a factor of several. That is unsettling until you look at what each method was built from.
MIL-HDBK-217F Notice 2 is dated 28 February 1995, and it is still the last revision. Its part models were fitted to components and manufacturing practice of that era, which is why predictions made with it are often pessimistic for modern microelectronics. Programmes keep calling for it because a contract clause says so, which is a perfectly real reason, just not a technical one.
FIDES, whose current edition is dated 2022 and which is maintained by a group of European defence and aerospace manufacturers under French Ministry of Defence supervision, was built around a different question. It works from a mission profile: what the equipment actually experiences in thermal cycling, humidity, vibration and on/off transitions, together with factors covering the quality of the development and manufacturing processes behind the product.
217Plus, developed by Quanterion from the 217 lineage, adds operating profiles, cycling effects and process grading. Telcordia SR-332, now at Issue 4, comes out of telecom practice and is built to blend laboratory and field data into the calculation.
Four methods, four assumption sets, four answers. Read that as a warning about the absolute number rather than a scandal about the methods, and it becomes the most useful thing prediction teaches: the assumption set is the deliverable, and the number is a consequence of it.
Where a prediction earns its keep
Everything valuable a prediction does is comparative.
Design A against design B, computed with the same model, the same profile and the same data sources, gives a defensible answer about which is better even when neither absolute figure would survive contact with the fleet. Model error common to both options largely cancels in the comparison. The same holds for before and after: reprice the failure rate when a thermal fix drops a junction temperature, or when a supplier substitution changes a quality grade, and the delta carries meaning the total does not.
The second use is ranking. Sort the contributors and a handful of parts usually account for most of the assembly's failure rate. That ordering is far more robust than the sum, and it tells the design team where an hour of engineering pays best. A programme that never computes a credible absolute number can still be steered well by a prediction that is right about which parts matter.
The third use is measurement against a budget. A prediction that can be read next to its allocation becomes an early-warning system: the subsystem drifting past the failure rate it was given shows up in the week the design changed, not at a review months later. Those same rates then feed the criticality numbers in the FMECA, the quantification under the fault trees, and the spares calculation.
Three questions that make it defensible
An assessor reading a prediction asks three things, and a prediction that answers all three is reviewable whatever its number says.
Which model, and why that one? Contract, sector convention and data availability are all legitimate answers. Silence is not.
Which mission profile? Ambient and internal temperatures, duty cycle, on and off cycling, environment category. A prediction without a stated profile cannot be reviewed at all, because the reviewer cannot tell which of the model's factors were exercised.
Where did each part rate come from? Handbook, supplier claim, fleet data or engineering judgement. All four are legitimate; unrecorded is not. Mixed sourcing across one bill of materials is normal and honest, provided the record says which parts came from where.
To that, add what a good prediction states about itself: software, wear-out, workmanship escapes and common-cause failures sit outside its scope. Writing the exclusions down protects the number from being asked to carry weight it was never built for.
When the field should overrule the handbook
Once a part or unit has accumulated real service hours in an application close to yours, that evidence beats any handbook for that part, in that application. Replacing generic population behaviour with observed behaviour is the whole point of running FRACAS and Weibull analysis in the first place.
Two cautions keep this honest. Enough hours is not the same as enough failures, and it is failures that carry the statistical weight; a rate estimated from two events arrives with an interval wide enough to swallow most design decisions. The operating context has to match as well, because a rate observed in a temperate installation says little about the same box in a desert enclosure.
When fleet data and prediction disagree sharply, treat the gap as a finding rather than an embarrassment. Usually one of three things is true: the mission profile in the prediction does not describe the real duty cycle, the observed failures are mechanisms the model never covered, or the returns include events that are not part failures at all. Each of those is worth knowing, and none of them is discovered by quietly adjusting the number until the two agree.
How RAMSynapse approaches this
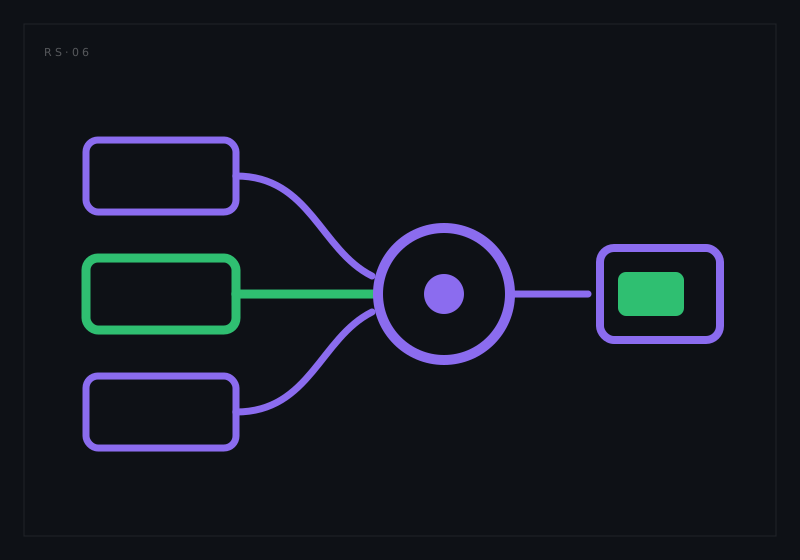
Almost every question above is about record-keeping rather than mathematics: which model, which profile, which source, and whether any of it still describes the current design. We built RAMSynapse so those answers are properties of the analysis rather than notes in a spreadsheet.
The part list arrives from PLM through a maintained integration, stresses and temperatures live on the same registry the prediction reads, and every value carries its source. Change a stress, substitute a component or revise a mission profile, and the affected rates recompute, then travel on to the allocation they are measured against, the FMECA that ranks them and the fault trees that consume them. The prediction stops being a document produced for a milestone and becomes a live statement about the design as it currently stands.
Ask a prediction for a promise and it will disappoint you, on schedule, in front of a customer. Ask it which of two designs is better and why, and it will answer honestly every time something changes.
Want to see a prediction reprice itself the moment a stress moves? Request a walkthrough.