

Ask a RAMS engineer what tools their programme uses and you will get a list: a prediction tool, an FMECA spreadsheet, a fault-tree package, a maintainability workbook, a FRACAS database. Ask them how those tools talk to each other and you will usually get a pause, because the honest answer is "through me, by hand, when I have time."
That pause is where programmes lose months, and where safety cases quietly age. This article is about the connections themselves: which value flows from which method to which, why each link exists, and what breaks when it is missing.
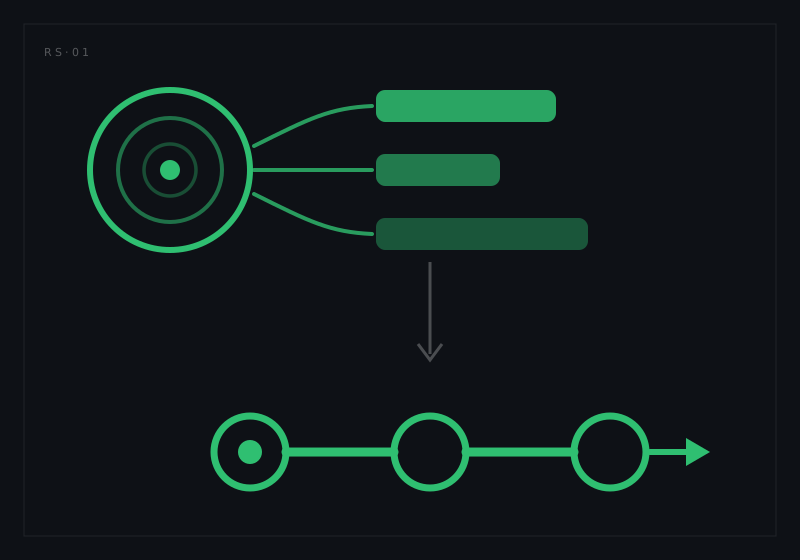
The reliability chain: allocation → prediction → RBD
Allocation breaks the system-level target (the contractual MTBF, the tolerable hazard rate) down the product structure, so every subsystem owner knows the budget they carry. Prediction then computes what the design actually achieves, part by part, stress by stress. The link between them is the whole point: a prediction that cannot see its allocation is just a number, but a prediction compared live against its budget is an early-warning system. The supplier whose unit overruns its failure-rate budget finds out the week the BOM changed, not at the design review.
RBD consumes the same failure rates to answer the availability question: not "how often does a unit fail" but "what does the system-level architecture (redundancy, standby, repair) make of those failures." Same inputs, different question. Retype the rates into a separate RBD tool and the two answers diverge within a month.
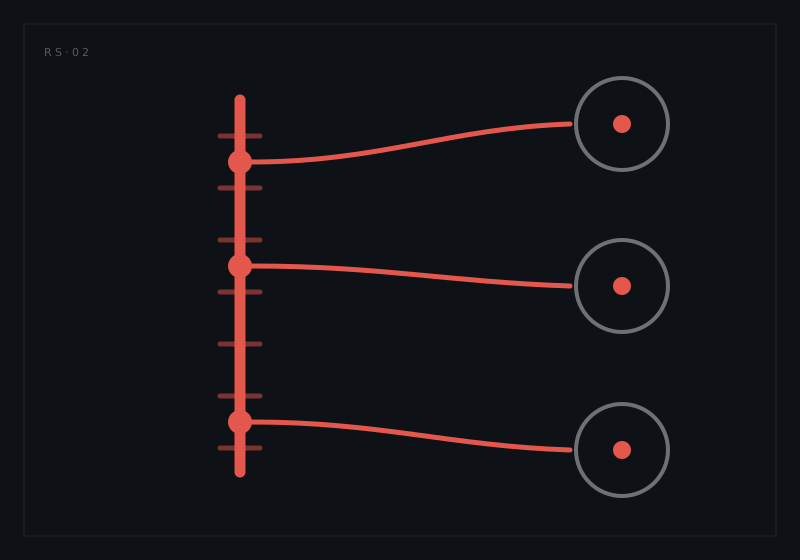
The failure-mode spine: FMECA feeds everything
The FMECA is the programme's failure-mode inventory, and at least three other methods stand on it:
- Fault trees quantify top events using the same failure modes and the same rates the FMECA carries. When the FMECA and the FTA maintain separate failure-mode lists, every safety review begins with an archaeology session to reconcile them.
- Testability analysis asks which failure modes the built-in test can detect and isolate, a question that only means something against the current failure-mode list.
- The maintainability chain plans repair around what actually fails and how often. Corrective-maintenance burden is failure rates times repair times; both halves live in other analyses.
One failure-mode inventory, referenced everywhere, is the single highest-leverage connection in the discipline.
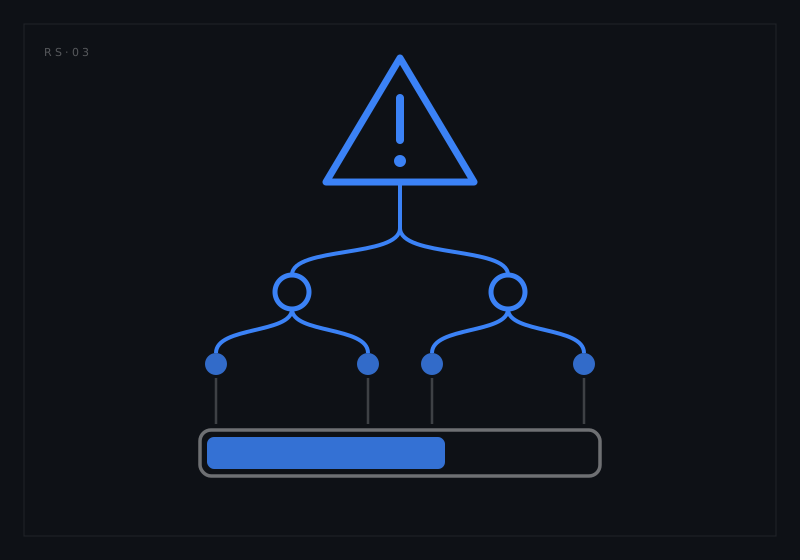
The safety chain: FHA → FTA → budgets
The functional hazard assessment declares what must not happen and how improbable it must be. The fault tree demonstrates, quantitatively, whether the design meets that bar, and the allocation carries the derived budgets down to the hardware that must honour them. This chain is the safety case's load path. It is also, on disconnected programmes, the chain most often reconstructed by hand the month before certification review, because the three artefacts lived in three tools with three version histories.
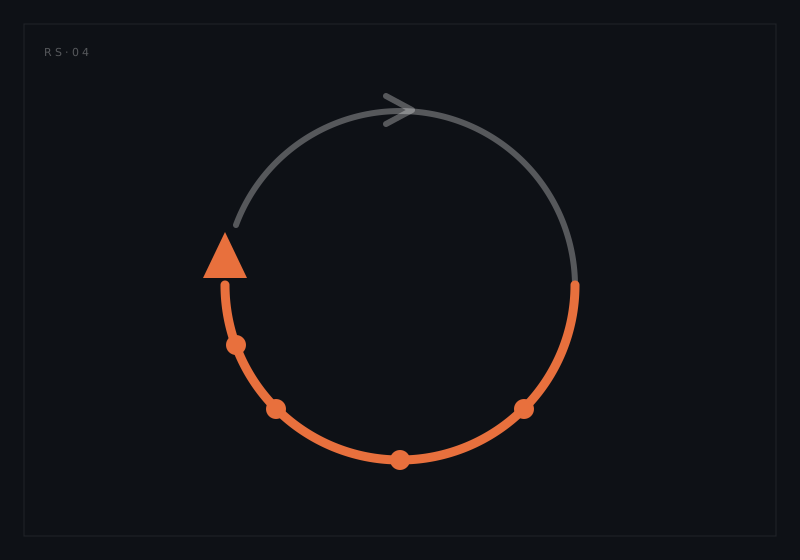
The field loop: FRACAS and Weibull close the circle
Everything above is prediction until the fleet starts reporting. FRACAS captures what actually failed; Weibull analysis turns the life data into distributions the design analyses can use. The loop closes when observed rates flow back to recalibrate predictions, re-age the FMECA, and re-quantify the trees, honestly, on evidence.
The loop also has a quality dimension. Field reports arrive in maintainer language: inconsistent vocabulary, half-remembered part numbers, symptoms described at whatever level the shift allowed. Turning them into rates the design analyses can consume means mapping every event onto a failure mode the FMECA already carries, and that mapping is engineering work, not filing. Programmes that skip it end up recalibrating their predictions with data nobody trusts, which is worse than not recalibrating at all, because the numbers now carry an authority they have not earned.
A programme without this loop is navigating by dead reckoning years after it had GPS. And a loop that runs through annual manual data transfers is not a loop; it is a yearly reconciliation project.
Beyond today's links
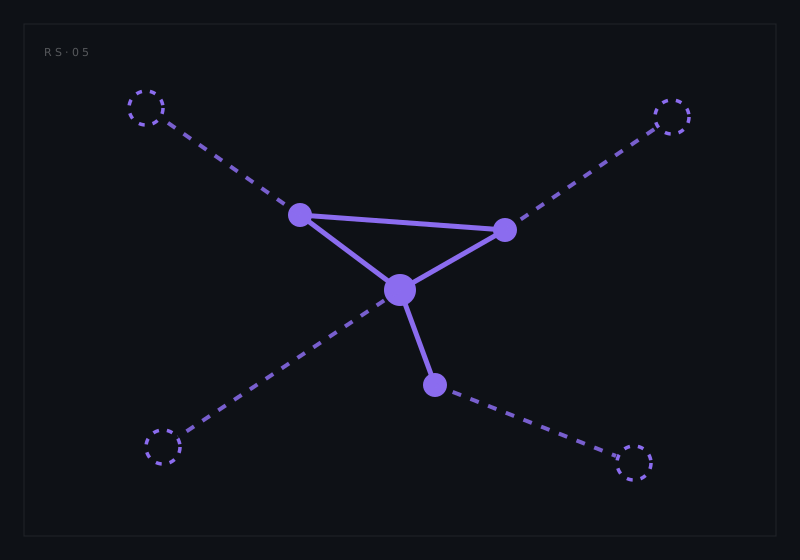
The links above are the ones we have built or designed so far. Programmes we talk to keep pointing at more, and the set is drawn to grow:
- Derating → prediction: stress-analysis results feeding the part-stress models directly, so a thermal margin change reprices the failure rate the same day.
- Testability → FRACAS: diagnostic-coverage claims validated against real fault-isolation outcomes from the field, closing a loop most programmes never instrument.
- RBD → LORA and sparing: availability models informing repair-level economics and spares ranging with the same failure data everyone else uses.
- Prediction → PHM thresholds: the expected-life baseline that condition-monitoring anomalies are measured against.
The principle behind every one of them is identical: a value computed once, consumed everywhere, retyped never.
What disconnection actually costs
The costs are rarely visible as a line item, which is why they persist:
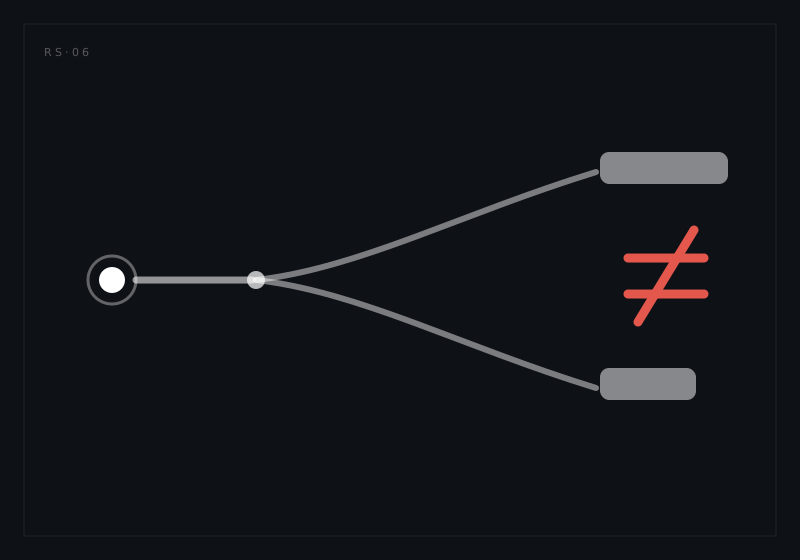
- Version drift. The FMECA references failure rates from March; the fault tree from June. Both are "current." Neither agrees with the prediction.
- Contradiction at reviews. Two analyses answer the same question with different numbers, and the review burns its hour on reconciliation instead of engineering.
- The aging safety case. Every design change silently invalidates hand-copied numbers downstream. The case is correct on the day it is written and decays from there.
- The integration engineer nobody hired. Someone senior spends a third of their time moving numbers between tools. Their job title says reliability engineer; their calendar says clerk.
What makes these costs durable is that every one of them has a workaround, the workaround has an owner, and the owner is coping. Nobody escalates a problem they are quietly absorbing. So the programme pays the tax every month, budgets for it implicitly in every schedule, and calls the arrangement normal, right up until a certification review asks why two artefacts disagree and the answer takes three weeks to assemble.
The registry, not the export
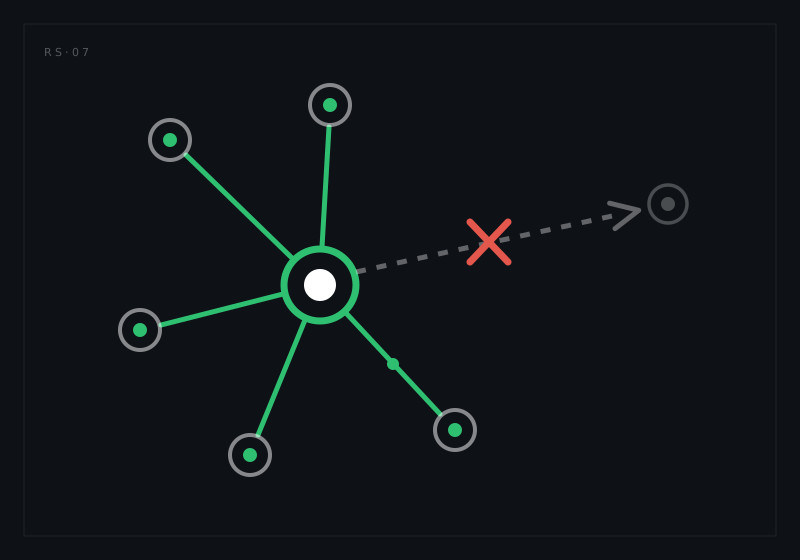
The fix is not "more exports." Export-import is disconnection with extra steps; the numbers still fork the moment they land. The fix is an architectural one: a registry where each computed value lives once, carries its provenance, and is referenced by every consumer. When the value changes, every analysis that references it sees the change, and flags what that change disturbs.
That is the machine behind every link in this article. The live ring on our home page is not a marketing illustration; it is the actual dependency map of the platform, drawn from the same registry the analyses use. Click any module and it tells you exactly what it sends and receives.
Connected methods are not a convenience feature. They are what makes a RAMS programme's numbers mean the same thing everywhere, which is, in the end, what a certification authority is really asking you to prove.
Want to see the registry carry a value from allocation to fault tree on a live model? Request a walkthrough.