

Take one aircraft function on a light business jet: provide attitude information to the flight crew. Average flight length two hours. At the point this assessment is written the architecture is a sketch: some number of attitude sources, two primary flight displays, and a standby indicator. Nothing below that is decided, which is exactly the right state to be in. Every value here is an illustrative teaching figure.
The candidate grid, and what survived it
Five failure modes, six phases, two annunciation states: sixty candidate rows, generated mechanically. Merging the rows whose effect on the aircraft is identical, splitting the ones where the phase changes the outcome, and deleting the impossible combinations leaves nine failure conditions worth classifying. The merges are recorded, because that record is the answer to the first question a reviewer asks.
The worksheet
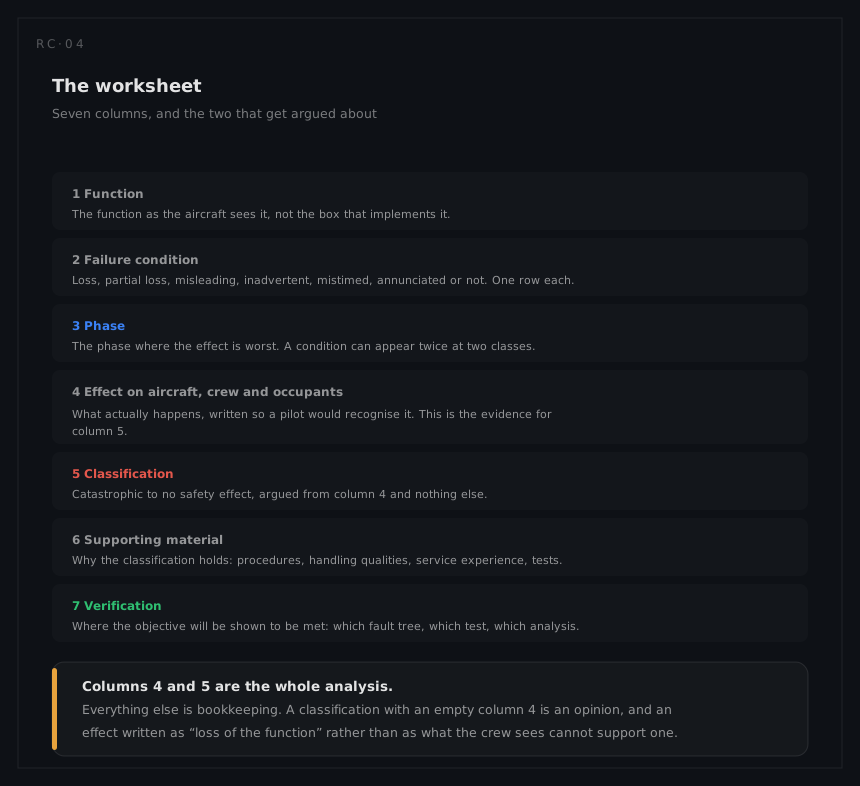
| # | Failure condition | Phase | Effect on aircraft, crew and occupants | Class |
|---|---|---|---|---|
| 1 | Loss of attitude on one display, annunciated | All | Flag on one display; crew transfers to the other; slight workload increase | Minor |
| 2 | Loss of attitude on both displays, annunciated, standby available | Cruise, VMC | Crew flies on the standby indicator with outside reference available; significant workload increase, diversion likely | Major |
| 3 | Loss of attitude on both displays, annunciated, standby available | Approach, IMC | Crew flies a partial-panel approach in cloud on a small standby instrument; large reduction in safety margins, crew physical distress | Hazardous |
| 4 | Loss of all attitude information including standby | IMC, any phase | No attitude reference in cloud; loss of control is the expected outcome | Catastrophic |
| 5 | Misleading attitude on one display, comparator annunciates | All | Comparator flags a disagreement without saying which display is wrong; crew uses the standby to identify the failed source and continues on the good display; significant workload increase | Major |
| 6 | Misleading attitude on both displays, annunciated | Approach, IMC | Crew knows the displays are wrong and flies the standby; as row 3 | Hazardous |
| 7 | Misleading attitude on both displays, unannunciated | Approach below 200 ft | Crew follows a plausible but wrong attitude with no cue that it is wrong, at low altitude with no time to detect the error from other instruments | Catastrophic |
| 8 | Misleading attitude on both displays, unannunciated | Cruise | The error is available to be caught from other instruments and outside reference; an upset is possible before it is | Hazardous |
| 9 | Attitude presented with excessive lag | Approach, IMC | Pilot-induced oscillation in manual flight; significant reduction in margins | Major |
Three pairs in that table carry the whole lesson of the method.
Rows 2 and 3 are the same failure in two phases, and the phase alone moves them a class apart. Neither row can be deleted: the aircraft has to meet the harder one, and the easier one is what most of the fleet's flights will actually see.
Rows 6 and 7 are the same failure with and without annunciation, and annunciation is worth a whole class. That single fact is what buys the comparison monitor its budget, and it is the reason the testability analysis and the safety assessment cannot be done in separate rooms.
Rows 4 and 7 are both catastrophic and share nothing. One is the absence of information, defeated by having more sources; the other is wrong information, which more sources make more likely unless something compares them. An architecture optimised against row 4 alone gets row 7 wrong.
The objectives that fall out
| Class | Average probability per flight hour | Per two-hour flight |
|---|---|---|
| Catastrophic, rows 4 and 7 | 1 × 10⁻⁹ | 2 × 10⁻⁹ |
| Hazardous, rows 3, 6 and 8 | 1 × 10⁻⁷ | 2 × 10⁻⁷ |
| Major, rows 2, 5 and 9 | 1 × 10⁻⁵ | 2 × 10⁻⁵ |
| Minor, row 1 | 1 × 10⁻³, no obligation to quantify | 2 × 10⁻³ |
Plus the qualitative requirement, which at this point in the programme is the more useful of the two: no single failure may produce rows 4 or 7, and any pair of failures relied on to prevent them has to be shown independent.
Converting row 7 into something a supplier can be given
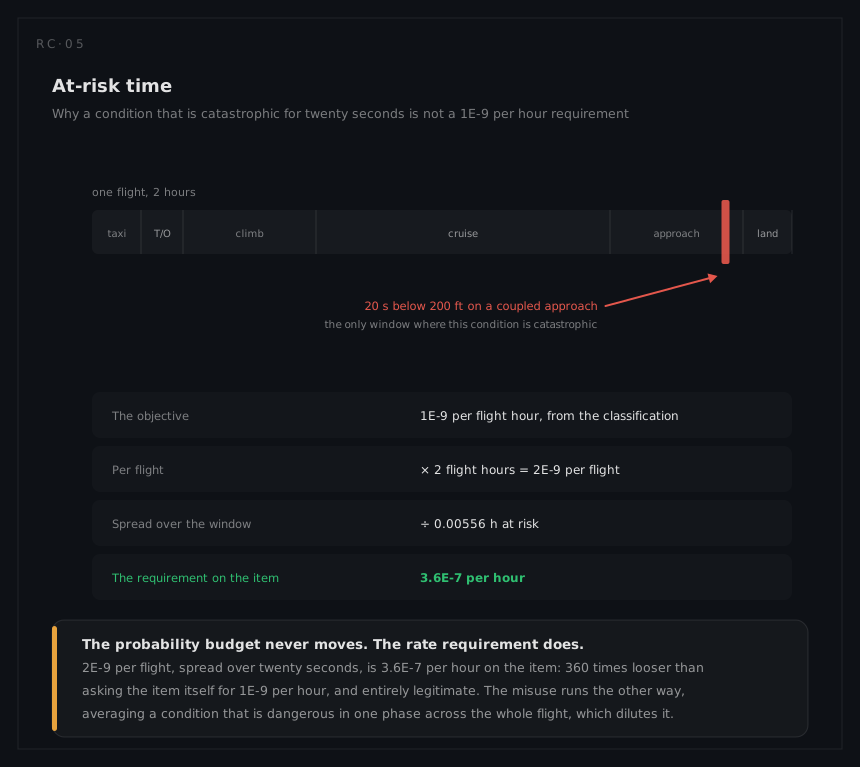
Row 7 is catastrophic only where the crew has no time to detect the error from other cues: the last twenty seconds of a coupled approach. The conversion:
2 × 10⁻⁹ per flight ÷ (20 ⁄ 3600) h = 3.6 × 10⁻⁷ per hour
Row 4 is different, and the difference is instructive. It is catastrophic whenever the aircraft is in cloud, which is not a twenty-second window and is not a fixed fraction of every flight. The conservative treatment, and the one taken here, is to carry the whole flight as at-risk time rather than to divide by a fleet-average instrument-meteorological-conditions fraction that nobody can substantiate. The at-risk correction is legitimate where the window is a defined phase; it is an invitation to trouble where the window is a weather statistic.
What the classification does to the architecture
The assessment has not chosen an architecture, but it has now constrained it, and this is where the FHA earns its place before the design rather than after it:
| From | Requirement on the design |
|---|---|
| Row 7 catastrophic, no single failure | Misleading output from one source must not reach both displays unchallenged. Something has to compare independent sources |
| Rows 6 against 7, one class apart | The comparison has to annunciate, and the annunciation path cannot share a failure with the thing it is annunciating |
| Row 4 catastrophic | An attitude source independent of the primary ones, with independent power, reachable from the pilot's normal scan |
| Rows 3 and 6 hazardous | The standby has to be flyable in IMC by a crew that is already busy, which is a human-factors requirement, not an availability one |
Three sources with a two-out-of-three comparison, a standby indicator on its own sensor and battery, and a comparison monitor in each display computer is one architecture that satisfies all four rows. It is not the only one, and choosing between candidates is the PSSA's job rather than the FHA's.
Assurance levels
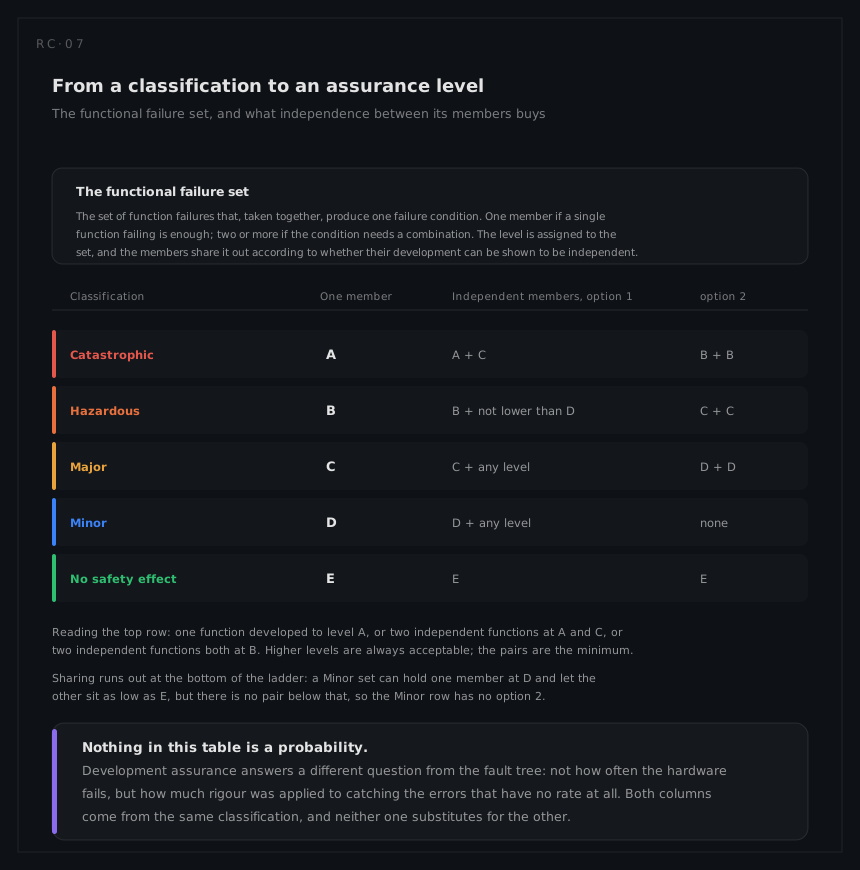
Row 7 needs two things to go wrong: the attitude data has to be wrong, and the comparison has to fail to say so. That is a two-member functional failure set, and if the independence of the two developments can be shown, the catastrophic classification can be met by one member at Level A and the other at Level C, or by two independent members both at Level B.
This programme argued independence from different suppliers, different sensing technology in the sources against a purely arithmetic comparison, and separately written and reviewed requirements, and took the first option: the comparison function at Level A, the data generation function at Level C. The allocation could have been made the other way round; what cannot be done is to claim the sharing without the independence argument, because the whole reduction rests on it.
One item resists the sharing. The voting and switching logic decides which source reaches the display, so a design error in it defeats both members at once, and it is developed to the highest level applicable regardless of how the rest is split.
The verification column, written now rather than later
None of the above is a plan until every row names the evidence that will close it. Written here, the column is a schedule and a budget; written after the design is fixed, it is a list of surprises.
| # | How compliance will be shown | Who owns the evidence |
|---|---|---|
| 1 | Similarity to the display supplier's in-service data; nothing to quantify | The display supplier |
| 2 | Fault tree to 2 × 10⁻⁵ per flight | Systems safety |
| 3 | Fault tree to 2 × 10⁻⁷ per flight, plus a simulator assessment of the partial-panel approach | Systems safety, with flight test |
| 4 | Fault tree to 2 × 10⁻⁹ per flight, plus the common cause analysis behind the standby's independence | Systems safety |
| 5 | Fault tree to 2 × 10⁻⁵ per flight, plus the comparator's detection coverage | Systems safety, with testability |
| 6 | Fault tree to 2 × 10⁻⁷ per flight, sharing the comparator branch with row 7 | Systems safety |
| 7 | Fault tree to 2 × 10⁻⁹ per flight over the twenty-second window, plus simulator measurement of the crew detection time the tree assumes | Systems safety, with flight test |
| 8 | Fault tree to 2 × 10⁻⁷ per flight, with the cross-check against other instruments credited as detection | Systems safety, with testability |
| 9 | Fault tree to 2 × 10⁻⁵ per flight, plus a handling-qualities assessment of the lag, which is a test rather than an analysis | Flight test, with systems safety |
Two entries are worth reading twice. Row 7's simulator trial exists because the tree cannot be written without a detection time, and a detection time nobody measured is an assumption dressed as a number. And row 1, with no quantitative objective at all, still carries an entry: the classification itself is a claim, and a claim nobody undertakes to support is the one that gets argued about in the last month of the programme.
What leaves the room
| Output | Goes to |
|---|---|
Rows 4 and 7 as top events at 2 × 10⁻⁹ per flight, row 7 with its 20 s window | Fault tree analysis |
Rows 3, 6 and 8 at 2 × 10⁻⁷ per flight | Fault tree analysis |
| The requirement that misleading output be annunciated, with the class it is worth | Testability: detection coverage and false alarm budget |
| Level A comparison, Level C data generation, highest level for the voting logic | Development assurance planning |
| The assumed reversion to the standby indicator | Procedures, training, and the flight deck layout that makes it possible |
| Nine conditions with a verification method each | The certification plan |
The next module takes row 7 and builds the tree.