

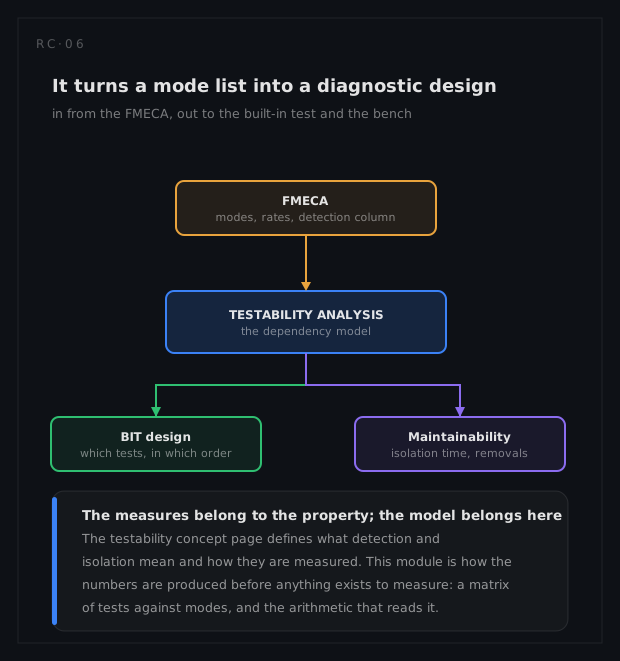
The testability concept page defines what detection and isolation mean and how they are measured: fault detection rate, fault isolation to one item or to a group, false alarm rate. Those are measurements of a finished machine. This module is how the same numbers are produced before there is a machine to measure, and the answer is a single object: a matrix of tests against faults.
Write the failure modes across the top and the available measurements down the side, mark a cell where the test responds to that fault, and every testability question becomes a reading of that grid. A column of zeroes is a fault nothing detects. Two identical columns are faults nothing can tell apart. A row of mostly zeroes is a test earning very little. The detection and isolation percentages are those readings weighted by failure rate, and the diagnostic procedure in the maintenance manual is the same grid searched in a sensible order.
The value is in when it can be done. A dependency model needs a functional breakdown and a list of candidate measurements, both of which exist long before hardware, so the analysis can change what gets built rather than describe what did.
What the analysis actually is
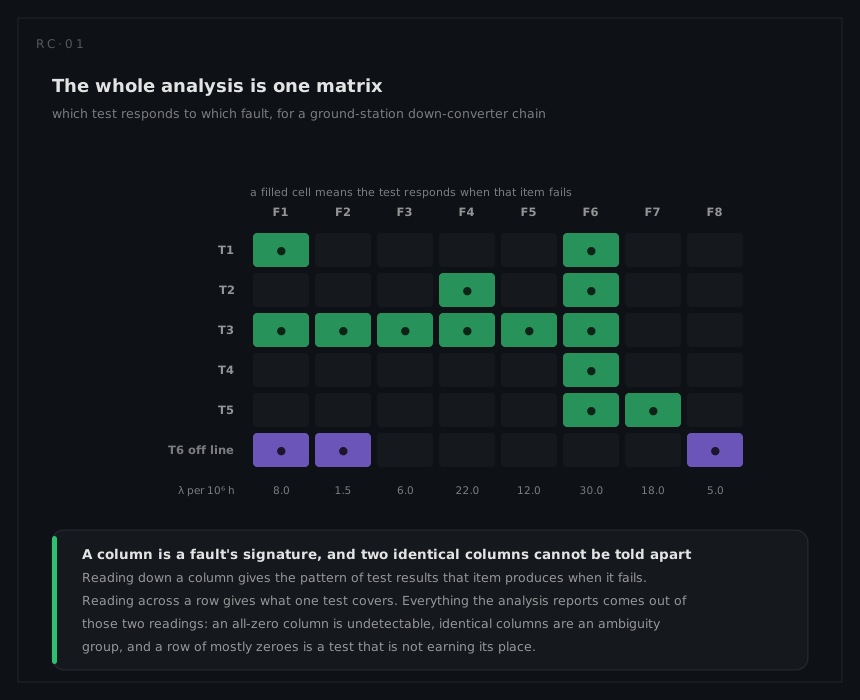
The technique has two names in the literature that mean the same thing. As a dependency model it is a graph: a fault propagates along signal paths to the points where a test can observe it, and the matrix is the reachability of that graph. As a fault-test incidence matrix it is just the table. Either way the analysis is:
| Step | Produces |
|---|---|
| Enumerate the faults | The FMECA mode list, one column per mode, each carrying λm = α · λp |
| Enumerate the candidate tests | Built-in test, external stimulus, an operator's observation, an off-line measurement |
| Mark the incidence | The matrix, one cell at a time, from the design |
| Read the columns | Undetected faults, ambiguity groups, and the metrics |
| Read the rows | Test value, redundancy between tests, the diagnostic order |
Where it sits, and what it is not
MIL-STD-2165 established testability as a programme activity with its own requirements, analysis and demonstration rather than as a by-product of design, and MIL-HDBK-2165 carries the guidance behind it. IEEE Std 1522-2004 put a formal, failure-rate-weighted vocabulary under the metrics themselves, although it was issued for trial use and has since been withdrawn, and MIL-STD-1309D is where the terms of test and diagnosis are defined so that two organisations arguing about a false alarm are arguing about the same thing.
| Programme stage | What the analysis is for |
|---|---|
| Concept | Are the measurements even available? Deciding what must be observable is a design requirement |
| Preliminary design | The first matrix: detection and isolation predictions against the requirement |
| Detailed design | Test selection and placement, the diagnostic strategy, BIT specification |
| Verification | Fault-insertion demonstration: seeded faults, scored detections and isolations, compared with these predictions |
Three things it is not. It is not the FMECA: the modes come from there and this analysis adds only what observes them. It is not a false-alarm analysis: the matrix says what a test responds to, not how often it responds when nothing is wrong, and that needs its own treatment. And it is not a diagnostic tool by itself: it produces the strategy a tool or a manual then implements.