

The analysis is short once the inputs exist, and the inputs are where it is usually lost: a fault list that is not the FMECA's, a test list that contains only what has already been designed, and cells filled in by whoever built the spreadsheet.
0. Check that the design can be tested at all
The dependency model asks which of the available measurements responds to which fault. It cannot ask whether the design permits a useful measurement to exist, and that question is the other half of a MIL-STD-2165 programme: the inherent testability assessment, run as a design review against a checklist rather than as arithmetic.
| Design feature | What is being checked |
|---|---|
| Partitioning | Whether the functional boundaries coincide with the replaceable-unit boundaries. Where they do not, the matrix produces ambiguity groups that no added test can split |
| Test access | Whether a point exists at which each function's signal can be observed, and one at which a stimulus can be applied |
| Observability and controllability | Whether an internal node can be driven to a known condition and its response read, or whether it sits behind something that hides it |
| Initialisation | Whether the item can be put into a known state before a test, so that a reading means one thing rather than several |
A matrix built on a design that fails this review is not wrong; it is faithfully reporting that little can be distinguished, and the fix is a design change rather than another test. The two halves run together, the checklist deciding whether the matrix can carry ones in useful places and the matrix pricing what those ones are worth. The design levers themselves belong to the testability design chapter.
1. Fix the level the analysis works at
Testability is stated at a level of repair: isolation to one line-replaceable unit means something different from isolation to one card inside it. The level decides what counts as an item, and therefore what counts as an ambiguity group. Programmes that analyse at one level and quote requirements at another produce numbers that cannot be compared with anything.
2. Take the fault list from the FMECA
Not a new list. The FMECA has already enumerated the modes and attached a rate to each through its α ratios, and those rates are what every metric is weighted by. Two disciplines here: modes, not items, because a valve that fails open and one that fails shut are different rows in the matrix; and coverage is checkable, since every mode in the worksheet either appears in the matrix or has a recorded reason for not appearing.
3. Enumerate every candidate test, including the ones nobody has built
The list is deliberately wider than the design: built-in test, an existing sensor read differently, an operator's observation, a measurement available only on the bench, a test that would need a new sensor. Including tests that do not exist is the point of doing this early: the analysis is how a new observation point earns its place, and it cannot earn anything if it was never on the list.
4. Fill the matrix from the design
One cell at a time, from a signal path, a simulation or a judgement, with the source of each judgement recorded. A cell is one only if the test responds to that fault: not if it might, not if it would with a different threshold, and not if the fault would eventually cause something else that the test sees, which is a different fault's row.
5. Read the columns
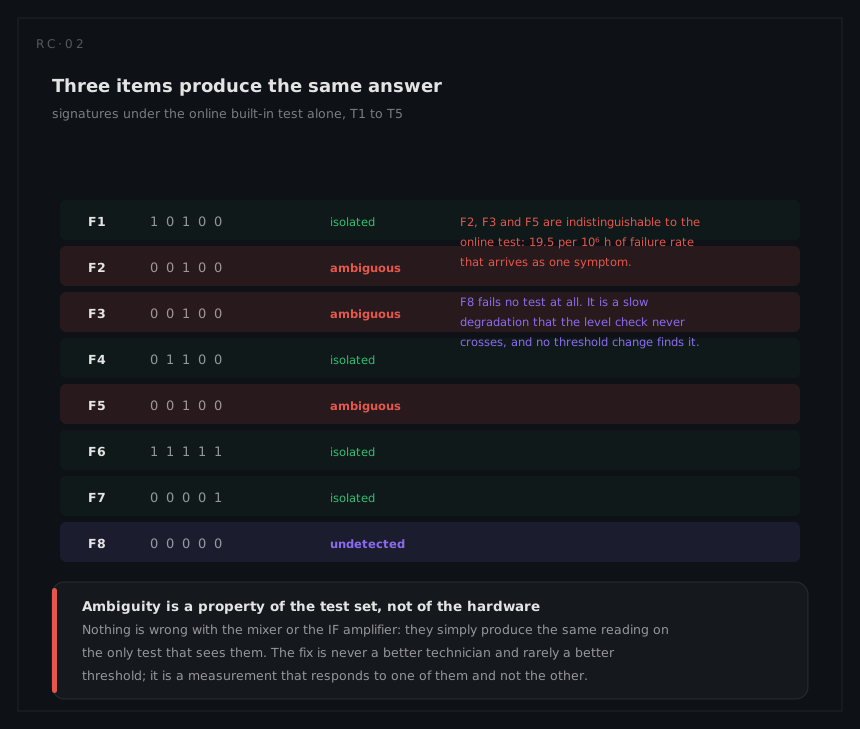
Sort the columns and the answer appears: identical columns are ambiguity groups, all-zero columns are undetected faults, and everything else is isolated. Then weight by rate to get FDR, FIR(1) and FIR(≤2), quoting isolation as a fraction of what is detected.
6. Read the rows, and price the gaps
Each undetected fault and each ambiguity group is a finding with a candidate fix, and the fixes are not interchangeable:
| Finding | The test that fixes it | What it buys |
|---|---|---|
| An all-zero column | A measurement that responds to that fault at all | Detection |
| An ambiguity group | A measurement that responds to some of the group and not the rest | Isolation |
| A group that no available measurement splits | Partitioning: make the items separately replaceable, or accept the group | Neither; it is a design change |
| A redundant row | Nothing. Delete the test | Cost |
7. Derive the diagnostic strategy
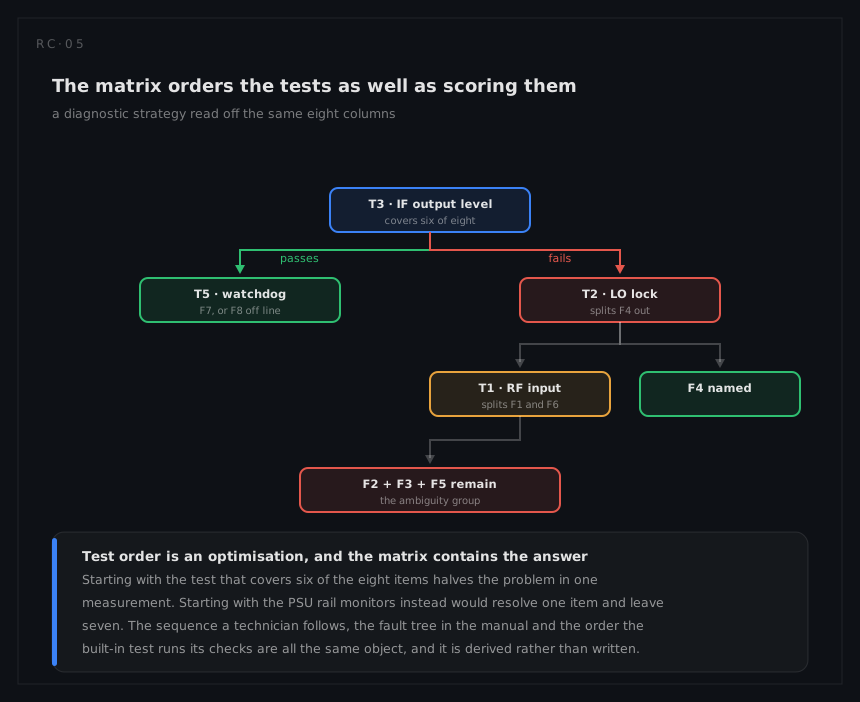
The order tests are run is an optimisation over the same matrix: at each step, choose the test that best splits the remaining candidates, weighted by their rates and by what the test costs to run. What comes out is simultaneously the built-in test's sequence, the fault tree in the maintenance manual and the technician's procedure, and deriving it once means the three cannot disagree.
8. Compute the false alarm ratio, from the other half of the data
The matrix says what each test does when a fault is present. What it does when nothing is wrong is a separate input per test, and it is the input a diagnostic system's credibility rests on. Give every test in the configuration a spurious-indication rate, from threshold-margin analysis, from the test hardware's own failure rate, or from field data on a predecessor, then
FARr = FA ÷ (FA + TA)
with TA the detected failure rate from step 5 and FA the sum of the spurious rates over every test in the configuration being scored. A test whose detections are counted in TA has its false indications counted in FA, whether it runs continuously or once a service visit.
Two consequences follow immediately and both belong in the report. Every test added for isolation adds its own false-alarm contribution, so isolation and believability move in opposite directions: in the worked example two extra tests take isolation from 66.2 to 79.6 per cent and FARr from 8.4 to 11.2. And FARr moves when detection moves, because the true-alarm rate is in its denominator, so a ratio that improved may only mean more real faults are now being found.
Reducing that figure is test design rather than dependency modelling, and the levers (persistence counts before an indication is annunciated, gating a test on the conditions it is valid in, voting several sensors) belong with the built-in test design rather than with the matrix.
Where the programme cannot yet estimate a spurious rate per test, the honest treatment is to say so and to carry the requirement forward, not to omit the figure. A report with two of the three numbers implies the third is satisfactory.
9. Re-run when the mode list moves
The matrix depends on the FMECA, and the FMECA moves: a mode added, an α corrected by field returns, a design change that removes a signal path. The cheapest way to keep the analysis current is to have it read the worksheet rather than a copy of it.