

Everything the analysis computes comes from one binary relation: test i responds to fault j, or it does not. Call the matrix D, with dᵢⱼ = 1 where the response exists. The rest is reading it two ways and weighting by failure rate.
Reading down: signatures and ambiguity
A fault's signature is its column: the pattern of results the test set produces when that fault is present. Three cases exhaust the possibilities:
| Column | Meaning | Consequence |
|---|---|---|
| All zeroes | No test responds | The fault is undetectable by this test set |
| Unique | No other fault shares the pattern | The fault is isolated to one item |
| Shared with others | Identical to one or more columns | Those faults form an ambiguity group |
An ambiguity group is a property of the test set, never of the hardware. Two items that produce the same reading on every available measurement are indistinguishable no matter how skilled the technician is, and no threshold change will separate them: the fix is a measurement that responds to one and not the other.
Reading across: what a test is worth
A test's coverage is its row: the faults it responds to. Two rows that are identical describe two tests that are diagnostically the same, whatever they cost. A row that is a subset of another describes a test that adds nothing once the other is present. And a row of mostly zeroes describes a test that is cheap to justify and hard to defend.
FDR, FIR and the false alarm ratio
Counting rows is the standard beginner's error, because a matrix has no idea that one mode happens twenty times as often as another. Every figure is a rate-weighted share, and each mode's rate is the FMECA's λm = α · λp.
Fault detection rate. The share of failure rate that some test responds to:
FDR = Σ λm over detected modes ÷ Σ λm over all modes
Fault isolation rate. The share resolved to one item, or to a group no larger than k, as a fraction of what was detected:
FIR(1) = Σ λm in groups of one item ÷ Σ λm over detected modes
FIR(≤k) = Σ λm in groups of k items or fewer ÷ Σ λm over detected modes
False alarm ratio. The share of indications raised when nothing has failed. This one does not come from the matrix at all, because the matrix only describes behaviour in the presence of a fault:
FARr = FA ÷ (FA + TA)
where TA is the detected failure rate and FA is the summed rate of spurious indications across the tests in the configuration being scored, arising from threshold margin, transients, and the test hardware's own failures. The other convention states the same behaviour as an absolute rate, FARh, false indications per operating hour, which avoids a denominator that moves whenever detection changes. Say which of the two a figure is, because they are not comparable and they do not even move together; this module quotes FARr throughout.
Three properties of that set matter more than the definitions. Isolation is denominated in detected faults, so improving detection can lower the isolation percentage while the design strictly improves. FARr shares its denominator with detection, so the same change can flatter it. And all three are weighted by mode rate, so an item-level analysis overstates them: on the worked example an item-level matrix claims 95.1 per cent detection where the mode-level answer is 85.3.
Why the columns are modes, not items
An item's failure rate divides among its modes through the FMECA's α ratios, and the modes do not share a signature. The worked example's low-noise amplifier fails 70 per cent of the time as a gain collapse, which the level check sees, and 30 per cent as a noise rise, which it does not. One column per item records "detected" and loses the second number entirely.
| Analysed as | What the matrix contains | What it reports |
|---|---|---|
| Items | One column per replaceable unit | Detection of anything about that unit |
| Modes | One column per FMECA row, carrying α · λp | Detection of the failure rate that is actually covered |
The gap between the two is not small and it is always in the same direction. Every item with a mix of detected and undetected modes contributes its whole rate to the item-level detection figure, so the item-level answer is an upper bound that a programme has no way of knowing it is quoting.
The cost of a group, in removals
An ambiguity group of n worked through one item at a time costs, on average,
(n + 1) / 2 removals per fault
so a group of three costs two removals to fix one, and the extra one is a good unit taken off and sent to stores. That expression is the bridge between a testability metric and a logistics cost, and it is why isolation, not detection, is usually what the support budget cares about.
Detection and isolation are different purchases
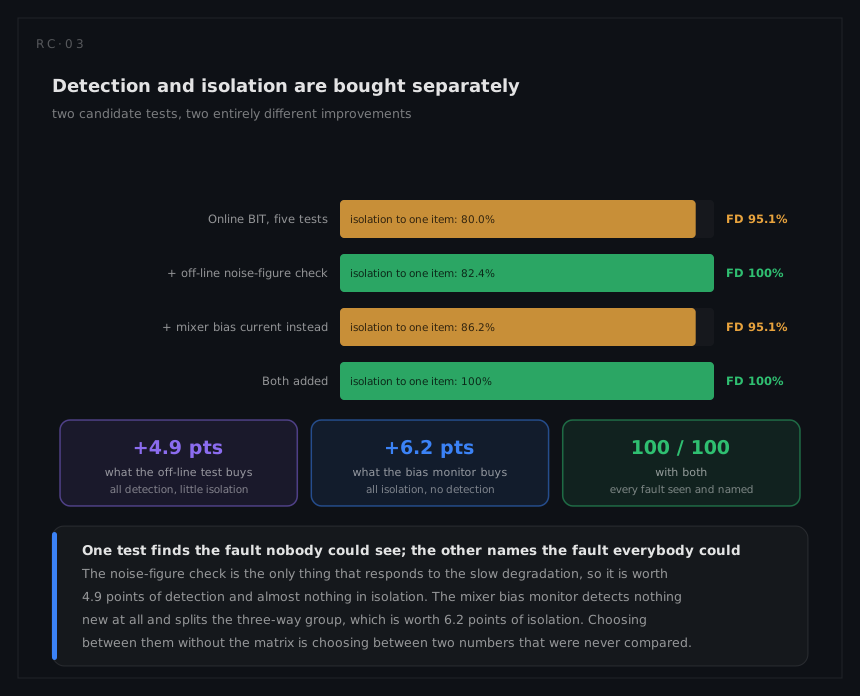
This is the result the model exists to produce, and it is invisible without one. A test that responds to a mode nothing else sees buys detection. A test that responds to some members of an existing ambiguity group buys isolation, and may detect nothing new at all. A third test may do both, or neither, and each of them adds its own false indications.
The three figures are therefore coupled, and the coupling has a direction:
| Adding a test that | FDR | FIR | FARr |
|---|---|---|---|
| Responds to modes nothing else sees, all alike | rises | falls: they arrive as one new group | falls, if its own spurious rate is low |
| Splits an existing ambiguity group | unchanged | rises | rises by its own spurious rate |
| Duplicates a test already present | unchanged | unchanged | rises. Delete it |
A programme with a single "testability" number cannot tell which of those it has bought, and a programme managing to an isolation target alone will reject the first row on sight.
Where the matrix comes from
The cells are engineering, not bookkeeping, and there are only three honest sources:
| Source | Confidence |
|---|---|
| The design: a signal path exists from the fault to the observation point | Strong, and checkable by inspection |
| Analysis or simulation of the response with the fault injected | Strong, and expensive |
| Engineering judgement | Weak, and the majority of most matrices |
A cell filled by judgement should be recorded as such, because the second most common way to overstate testability is a matrix full of optimistic ones, and the most common is the next section.
What the model cannot represent
- Partial or intermittent response. The cell is binary. A test that catches a fault only when it is hot, or only above a threshold, is either a one that overstates or a zero that understates, and neither is right.
- False alarms. The matrix says what a test responds to when a fault is present, and says nothing about what it does when nothing is wrong. False alarm rate is a separate analysis with separate data, and it is the figure that decides whether anybody believes the other two.
- Multiple simultaneous faults. Signatures are computed one fault at a time. Two faults together can produce a third signature that names an innocent item.
- Test sequence effects. A test that is only valid after another has passed, or that destroys the evidence for a later one, needs the strategy rather than the matrix.
- Wear and drift. A parametric fault that moves slowly crosses a threshold at some point; the matrix records the crossing, not the months before it.