

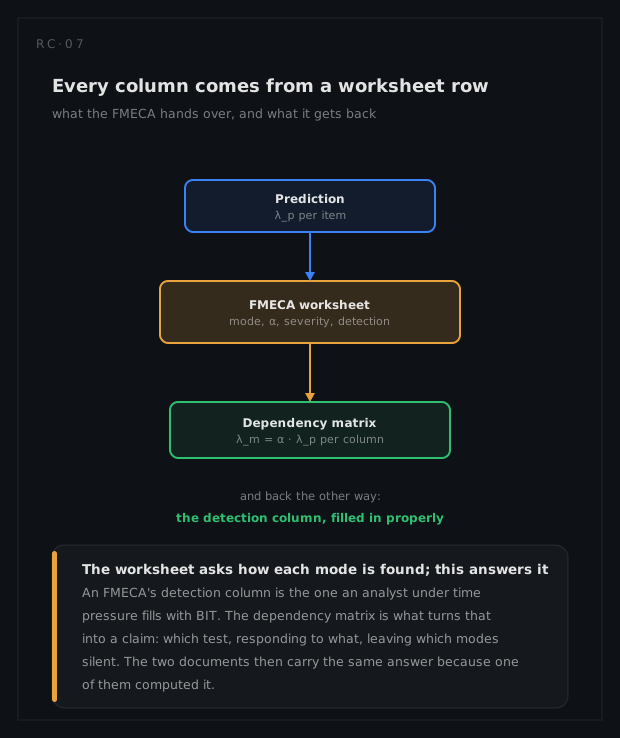
Consider the down-converter chain of a satellite ground station: eight replaceable items whose failure modes come straight from the FMECA worksheet, with each mode's rate already computed there as λm = α · λp. Every value is an illustrative teaching figure; the method is the standard's.
The fault list is the FMECA's mode list
| Mode | Item | λp | α | λm |
|---|---|---|---|---|
| M1 | LNA · gain collapse | 8.0 | 0.70 | 5.6 |
| M2 | LNA · noise rise, gain intact | 8.0 | 0.30 | 2.4 |
| M3 | Image filter · insertion loss rise | 1.5 | 1.00 | 1.5 |
| M4 | Mixer · conversion loss rise | 6.0 | 1.00 | 6.0 |
| M5 | Local oscillator · unlock | 22.0 | 0.65 | 14.3 |
| M6 | Local oscillator · phase noise rise | 22.0 | 0.35 | 7.7 |
| M7 | IF amplifier · gain loss | 12.0 | 1.00 | 12.0 |
| M8 | Power supply · rail out of tolerance | 30.0 | 1.00 | 30.0 |
| M9 | Controller · halt | 18.0 | 1.00 | 18.0 |
| M10 | Output isolator · slow degradation | 5.0 | 1.00 | 5.0 |
Σ λm | 102.5 |
The α column is what makes this an analysis rather than a checklist. The LNA fails at 8.0 per 10⁶ hours, and 70 per cent of that is a gain collapse the IF level check sees while 30 per cent is a noise rise it does not. Analysed as an item, the LNA is "detected". Analysed as modes, 2.4 per 10⁶ hours of it is not.
The matrix
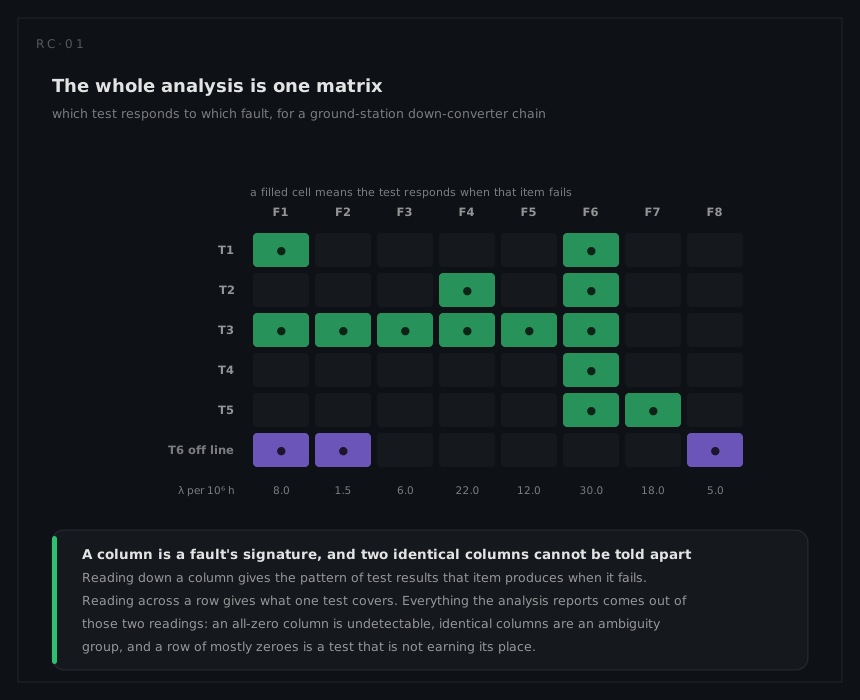
Five measurements are available: RF input power (T1), LO lock detect (T2), IF output level (T3) and the controller watchdog (T4) online, plus a noise-figure check (T5) that needs the chain off line.
FDR, FIR and the false alarm ratio, computed
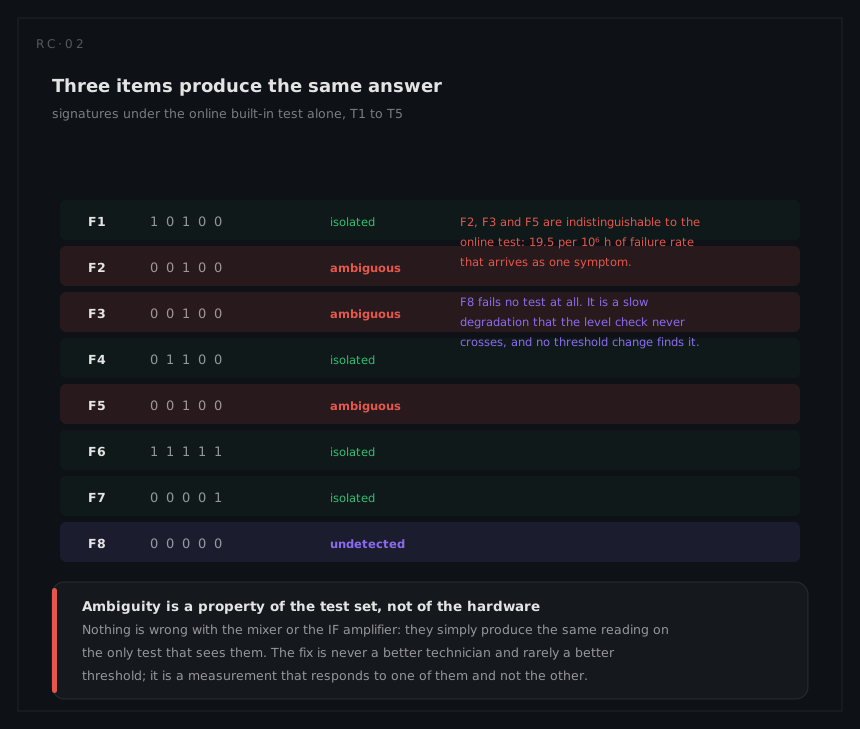
Fault detection rate, over the online tests. Three modes have an all-zero column, worth 2.4 + 7.7 + 5.0 = 15.1 per 10⁶ h:
FDR = (102.5 − 15.1) / 102.5 = 87.4 / 102.5 = 85.3 per cent
Fault isolation rate, as a share of what is detected. M3, M4 and M7 share the signature 0 0 1 0, three different items at 19.5 per 10⁶ h:
FIR(1) = (87.4 − 19.5) / 87.4 = 67.9 / 87.4 = 77.7 per cent
Because the three ambiguous modes belong to three separate items, FIR(≤2) is the same 77.7 per cent: a group of three is not resolved by allowing two.
False alarm ratio. This is the one the matrix cannot give, because it is about what the tests do when nothing has failed. Each test carries its own rate of spurious indications, from threshold margin, transients and its own hardware. The four online tests are what configuration A runs; the last three are priced here so the configurations below reproduce:
| Test | False indications per 10⁶ h |
|---|---|
| T1 · RF input power | 0.8 |
| T2 · LO lock | 1.2 |
| T3 · IF output level | 3.0 |
| T4 · Controller watchdog | 4.0 |
| The four online tests | 9.0 |
| T5 · Off-line noise figure | 0.4 |
| T6 · Mixer bias monitor | 2.5 |
| T7 · Phase-noise check | 1.0 |
FARr = FA / (FA + TA) = 9.0 / (9.0 + 87.4) = 9.3 per cent
About one alarm in eleven is raised by nothing at all. That figure decides whether the other two are acted on, and no amount of dependency modelling produces it.
Adding a test, and the result nobody expects
| Configuration | FDR | FIR(1) | FA per 10⁶ h | FARr |
|---|---|---|---|---|
| A · online BIT, four tests | 85.3% | 77.7% | 9.0 | 9.3% |
| B · + off-line noise figure (T5) | 100% | 66.2% | 9.4 | 8.4% |
| C · + mixer bias monitor (T6) | 100% | 72.1% | 11.9 | 10.4% |
| D · + phase-noise check (T7) | 100% | 79.6% | 12.9 | 11.2% |
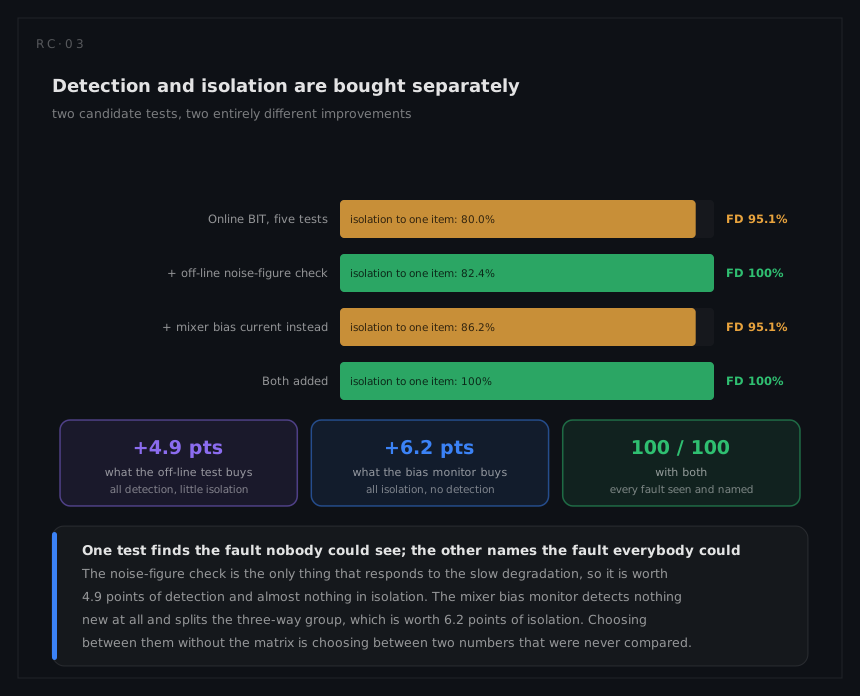
Configuration B is the lesson. The off-line noise-figure check responds to exactly the three modes nothing else sees, so detection goes to 100 per cent. But it responds to all three identically, so they arrive as a new three-way ambiguity group, and since isolation is a share of detected faults, FIR(1) falls from 77.7 to 66.2 per cent. The design strictly improved and one of its headline numbers went down. A programme managing to a single isolation target would read that as a regression and remove the test.
Notice also that B's FARr improves, from 9.3 to 8.4 per cent, even though a test was added and false alarms went up with it. T5 contributes 0.4 spurious indications per 10⁶ h, taking FA from 9.0 to 9.4, while the 15.1 it newly detects goes into the same denominator as true alarms:
FARr = 9.4 / (9.4 + 102.5) = 8.4 per cent
Two of the three figures moved for reasons that have nothing to do with what a reader would infer from them, which is the argument for quoting all three together with their bases.
C and D then buy isolation: the mixer bias monitor splits the mixer out of the first group, the phase-noise check splits the oscillator out of the second, and each brings its own false-alarm contribution, taking FA to 11.9 and then to 12.9, so FARr climbs from 8.4 to 11.2 per cent as isolation climbs from 66.2 to 79.6. That trade is the real design decision, and it is invisible unless all three are computed together.
What it costs at the bench
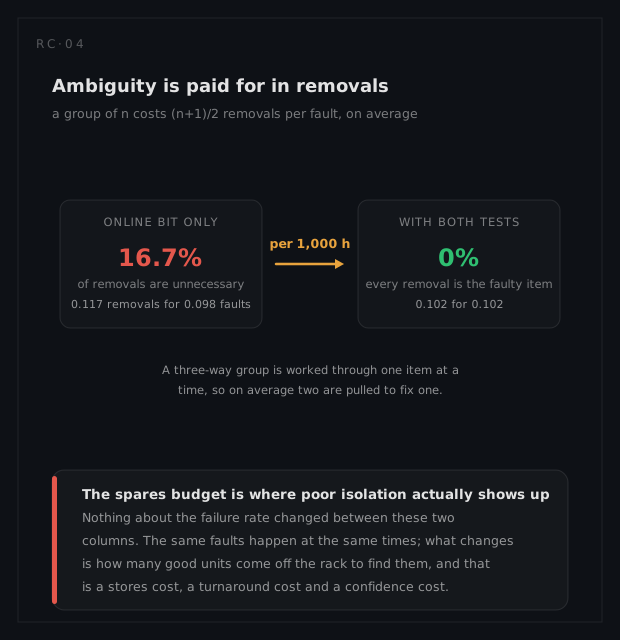
A group of n costs (n+1)/2 removals per fault:
| Configuration | Removals per 1,000 h | Faults present | Unnecessary |
|---|---|---|---|
| A | 0.107 | 0.087 | 18.2% |
| B | 0.137 | 0.102 | 25.2% |
| C | 0.124 | 0.102 | 17.6% |
| D | 0.113 | 0.102 | 9.3% |
B is worse at the bench than A in absolute terms: it pulls more modules. It is still the right change, because A was leaving 15.1 per 10⁶ hours of degradation in service undetected, and a slow noise rise on a receive chain is a customer complaint rather than an alarm. Detection and isolation have to be bought together, and the arithmetic above is what shows the size of the second bill.
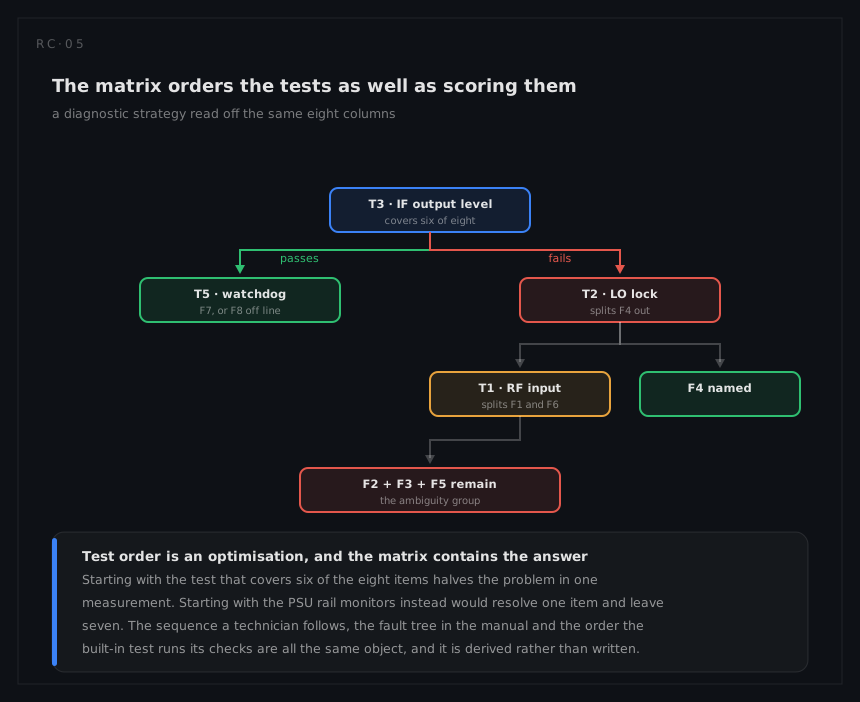
The strategy
What goes back to the FMECA
The detection column of the worksheet started as an assertion and comes back as a result:
| Mode | Detection, as recorded now |
|---|---|
| M1, M5, M8, M9 | Detected online and isolated to one item |
| M3, M4, M7 | Detected online, isolated to a group of three |
| M2, M6, M10 | Not detected online; found by the noise-figure check at the scheduled visit |
Those last three rows are what a safety or availability argument needs, because their exposure is not the mission but the interval between off-line checks. A worksheet whose detection column says "BIT" against all ten would have hidden that entirely.