

The method is a chain of definitions, and every link is one where an analysis can quietly stop being RCM. This chapter is the links.
The seven questions, in order
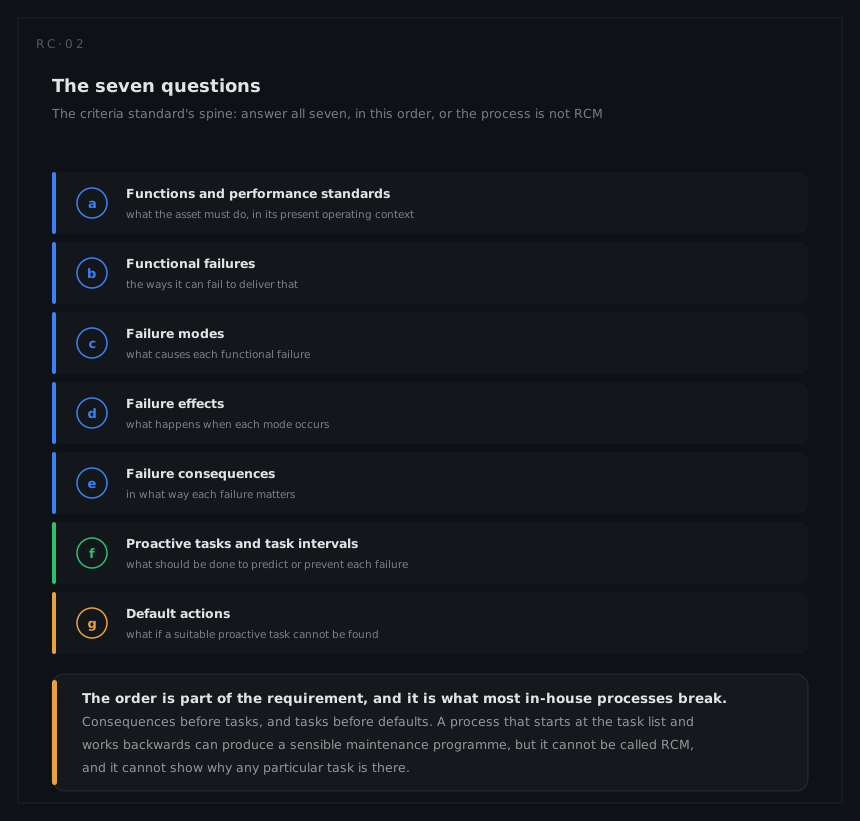
The criteria standard states seven questions and requires them to be answered in this sequence:
| Question | |
|---|---|
| a | What are the functions and associated desired standards of performance of the asset in its present operating context? |
| b | In what ways can it fail to fulfil its functions? |
| c | What causes each functional failure? |
| d | What happens when each failure occurs? |
| e | In what way does each failure matter? |
| f | What should be done to predict or prevent each failure? |
| g | What should be done if a suitable proactive task cannot be found? |
Answering them out of order is the most common way an in-house process fails an audit against the standard. A process that begins with a task list and reasons backwards can still produce a sensible programme, but it cannot show why any individual task exists, and it will never find the tasks that are missing.
The operating context is an input, not a preamble
The first question contains a clause that carries more weight than the rest of the sentence: in its present operating context. The same pump in a duty role and a standby role has different functions, different hidden failures and different answers. The same aircraft flown on two-hour sectors from a coastal base and on eight-hour sectors from a dry one has different intervals.
Recording the context is what makes an analysis transferable, or honestly marks it as not transferable. It also decides the answers directly: redundancy, dispatch allowances, duty cycles, environment and the consequences of a stoppage all live here.
Functions, and the performance standard that makes them testable
A function is what the asset must do, stated with the standard it must meet. Deliver conditioned air is not a function; deliver 0.35 kg/s of air between 5 and 30 °C is. A function without a performance standard cannot have a functional failure, because there is no line to fall below, and everything downstream inherits the vagueness.
Two kinds are easy to miss. Secondary functions are the ones nobody mentions until they fail: containment, support, protection, appearance, comfort, compliance. And protective functions are the ones with no output at all in normal operation, which is the next section.
Evident and hidden, and why the distinction leads the logic

A failure is evident if it will become apparent to the operating crew, on its own, in the course of normal duties. A failure is hidden if it will not.
Hidden failures matter because a failed protective device changes nothing until the day it is needed. Its consequence is therefore not its own failure at all: it is the multiple failure, the protected function failing while the protection is already gone. That is why failure-finding exists as a task category, and why hidden functions get checked on a schedule even though nothing about them appears to be wrong.
The consequence classification the standard requires has two axes: hidden or evident, and safety or environmental against economic, where economic splits into operational (the failure costs output as well as repair) and non-operational (it costs only repair).
Applicable and effective, which are different tests
A task has to pass both, and they ask different questions:
| Test | Question |
|---|---|
| Applicable | Can this task technically do anything about this failure mode? |
| Effective | Given the consequence, is it worth doing? |

The four effectiveness criteria are keyed to the consequence:
| Consequence | The task must |
|---|---|
| Hidden | Reduce the risk of the multiple failure to a tolerable level |
| Evident, safety or environmental | Reduce the risk of that failure to a tolerable level |
| Evident, operational | Cost less than the operational consequence plus the repair, over comparable periods of time |
| Evident, non-operational | Cost less than the repair it avoids, over comparable periods of time |
And one rule that applies to all four: the assessment is made as if no specific task were currently being done. What the programme does today is not evidence that it is worth doing, which is the sentence that deletes tasks.
The task types

| Task | Applicable when |
|---|---|
| Condition-based | There is a definable potential failure, an identifiable P-F interval, and a task interval shorter than the shortest likely P-F interval |
| Scheduled restoration | There is an age at which the conditional probability of failure rises sharply, and restoration returns the item to its original resistance to failure |
| Scheduled discard | The same age condition, and discarding is preferable to restoring |
| Failure-finding | The failure is hidden, cannot be seen in normal operation, and an interval exists that makes the multiple failure tolerable |
| Servicing or lubrication | Replenishing a consumable prevents or delays the mode |
| Run to failure | Nothing above is both applicable and effective, and the consequence is not safety or environmental |
| Redesign | Nothing above is both applicable and effective, and the consequence is safety or environmental |
The last two are the default actions, and the difference between them is the whole ethics of the method. Where only money is at stake, doing nothing is a legitimate answer. Where safety or the environment is at stake, doing nothing is not on the list.
The P-F interval
For a condition-based task the standard asks for three things: a clearly defined potential failure, an identifiable P-F interval, and a task interval less than the shortest likely P-F interval. It also requires what is left after the check, the net P-F interval, to be long enough to take the action the check is there to trigger.
net P-F interval = P-F interval − task interval
The familiar rule of thumb, set the interval at half the P-F interval, is not in the criteria standard. It is practice convention, and it happens to satisfy all three requirements comfortably, which is why it survives. The tighter form of the same habit, the one the method and the worked example use, halves what is left after the time needed to act rather than the whole P-F interval. Both are conventions, and knowing that matters when the numbers get tight: what has to be defended is the three requirements, not the halving.
The harder truth about P-F intervals is that they are claims. They assert how an item degrades and how early a particular inspection method can see it, they are usually estimated rather than measured, and a task built on one inherits all of that uncertainty.
Failure-finding intervals
For hidden functions the interval is derived rather than chosen. The chain of reasoning is short:
multiple-failure rate ≈ demand rate × average unavailability of the protection
and for a function whose hidden failure rate is λh, checked every T hours and restored to working if found failed, the average unavailability is approximately
U ≈ λh · T ⁄ 2
so a tolerable multiple-failure rate fixes a maximum interval. The approximation assumes a constant hidden failure rate, a check that always reveals the failure and never induces one, restoration to as-new on discovery, and demands that are independent of the check schedule. Every one of those is worth stating in the report, because each is sometimes false and two of them are optimistic.
When the assumptions fail
Knowing that an assumption is optimistic is only useful if you know which way it moves the answer, and these do not all move it the same way. The last line is not a failed assumption but the case the formula was never written for:
| The case | What it does to the answer |
|---|---|
| The check does not reveal every failure | The fraction it misses stays failed until a later check or a demand finds it, so the true unavailability is higher than λh · T ⁄ 2 and the interval the formula allows is too long. Whatever coverage was assumed belongs in the report next to the interval |
| The check can itself break the protection | Every check carries a chance of leaving the device worse than it was found. Past some frequency, more checking makes the protection less available rather than more |
| The protection is out while it is being tested | The test is exposure of its own, roughly the test duration divided by the interval. Negligible for a two-minute check every 500 hours; not negligible for a shutdown test that takes a shift |
| There is more than one protective device | The multiple failure now needs all of them down together, so the exposure falls steeply with the number of devices. That only holds if the failures are independent and the checks are not all done at the same moment, by the same person, to the same procedure |
The first line shortens the interval and the next two put a floor under it that the formula does not have on its own: U ≈ λh · T ⁄ 2 goes to zero as T does, and no real check schedule behaves that way. An interval derived to three significant figures and then presented without the assumptions behind it is worth less than the same number with them written down.
Age exploration, and the fact underneath the whole method
Scheduled restoration and scheduled discard both require an age at which failure becomes markedly more likely. That is a property of the item, and for most items it does not exist. Where it is claimed, the claim needs evidence: life data, a wear-out mechanism, or an age-exploration programme designed to produce that evidence in service.
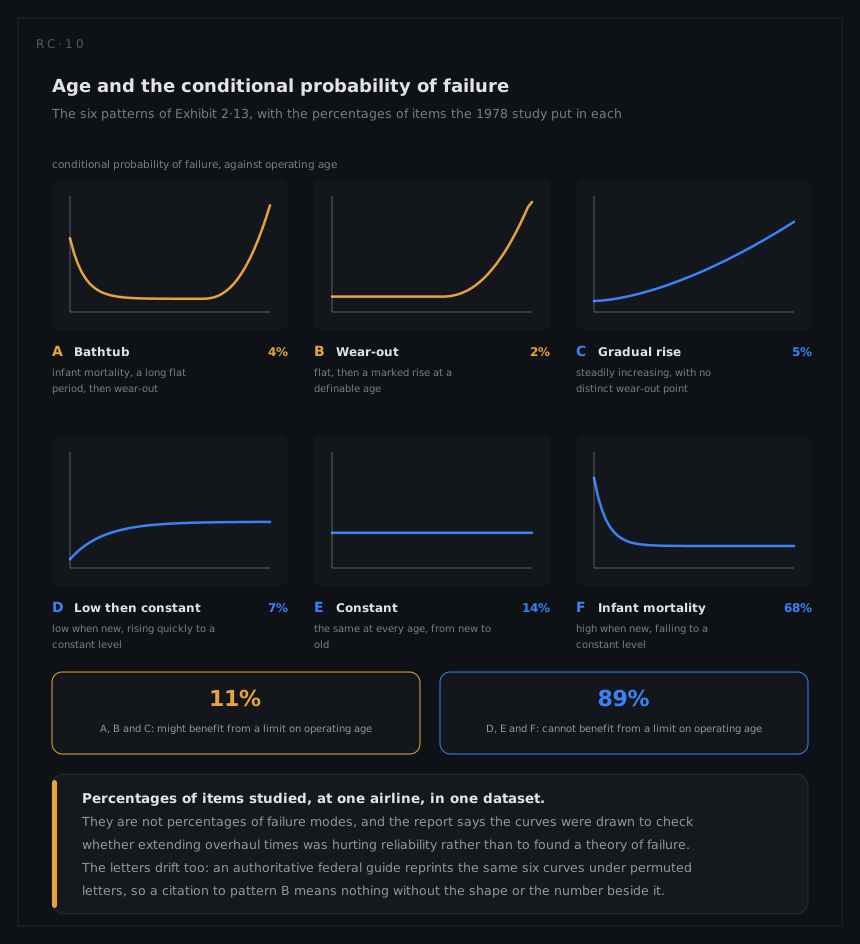
The finding that reorganised the industry is in the 1978 United Airlines report for the US Department of Defense, in Exhibit 2·13 on printed page 46. Six conditional-probability-of-failure patterns, labelled A to F, with the share of items falling into each:
| Pattern | Shape | Share |
|---|---|---|
| A | Bathtub: infant mortality, a long flat period, then wear-out | 4% |
| B | Flat, then a marked rise at a definable age | 2% |
| C | Steadily increasing, with no distinct wear-out point | 5% |
| D | Low when new, rising quickly to a constant level | 7% |
| E | Constant at every age | 14% |
| F | High when new, falling to a constant level | 68% |
The exhibit's own brackets group them: 11 per cent might benefit from a limit on operating age (A, B and C), and 89 per cent cannot (D, E and F). The report's text on the next page is narrower still: of the six curves only A and B show wear-out characteristics, and those two are associated with simple, single-celled items, tyres, brake pads, engine cylinders, compressor blades and the structure itself, while most complex items fall into C to F.
Four things about those numbers matter more than the numbers:
- They are percentages of items, not of failure modes. An item with several modes can hide a strong wear-out mode inside an aggregate curve that looks flat.
- They come from one operator's dataset, and the curves were originally drawn to check whether extending overhaul times was hurting reliability, not to found a general theory of failure.
- The percentages appear only as labels inside the exhibit artwork. They are not in the running text, which is why text-extracted copies of the report lose them and why so many secondary sources quote them second-hand.
- The letters drift. An authoritative federal RCM guide reprints the same six curves under a permuted set of letters, with each percentage still correctly attached to its own shape. A citation to "pattern B" therefore means nothing on its own: give the shape or the number with it.
| Study | A | B | C | D | E | F |
|---|---|---|---|---|---|---|
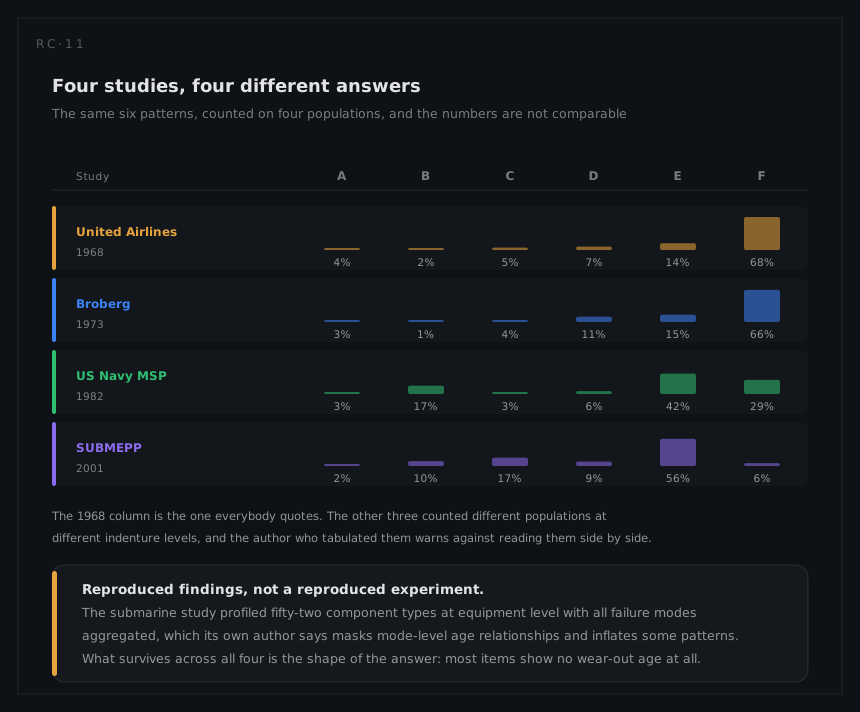
| United Airlines, 1968 | 4% | 2% | 5% | 7% | 14% | 68% |
| Broberg, 1973 | 3% | 1% | 4% | 11% | 15% | 66% |
| US Navy, 1982 | 3% | 17% | 3% | 6% | 42% | 29% |
| Submarine equipment, 2001 | 2% | 10% | 17% | 9% | 56% | 6% |
These columns are not comparable and the author who tabulated them says so. The submarine study profiled fifty-two component types at equipment level with all failure modes aggregated, which he warns masks mode-level age relationships; the naval and airline populations differ in kind as well as in indenture level. Quote the study you can cite, name it, and resist the urge to average them.
What is not in dispute is the direction, and it is the reason this method exists: for most items there is no age at which failure becomes markedly more likely, so a scheduled overhaul at a fixed age cannot improve their reliability, and the intrusive work introduces infant-mortality failures of its own.