

The output is a maintenance programme with a reason attached to every line, and the reasons are worth more than the programme. A programme can be copied; the reasons are what let the next team change it safely.
1. The task requirements
| Field | Why it travels with the task |
|---|---|
| The task, and what it is meant to detect or prevent | A task without its failure mode cannot be reassessed |
| The interval | The number the maintenance plan runs on |
| The computed maximum, where one exists | So packaging decisions stay visible and defensible |
| The consequence category | Which effectiveness test it passed, and how hard the bar was |
| The inputs the interval depended on | The P-F interval, the rates, the tolerable multiple-failure rate |
That third row is the one most often lost. An interval adopted at 500 hours against a computed maximum of 952 has a factor of 1.9 in hand; the same 500 hours recorded without the maximum looks arbitrary and gets extended by somebody who does not know what it was protecting.
2. The decisions to do nothing
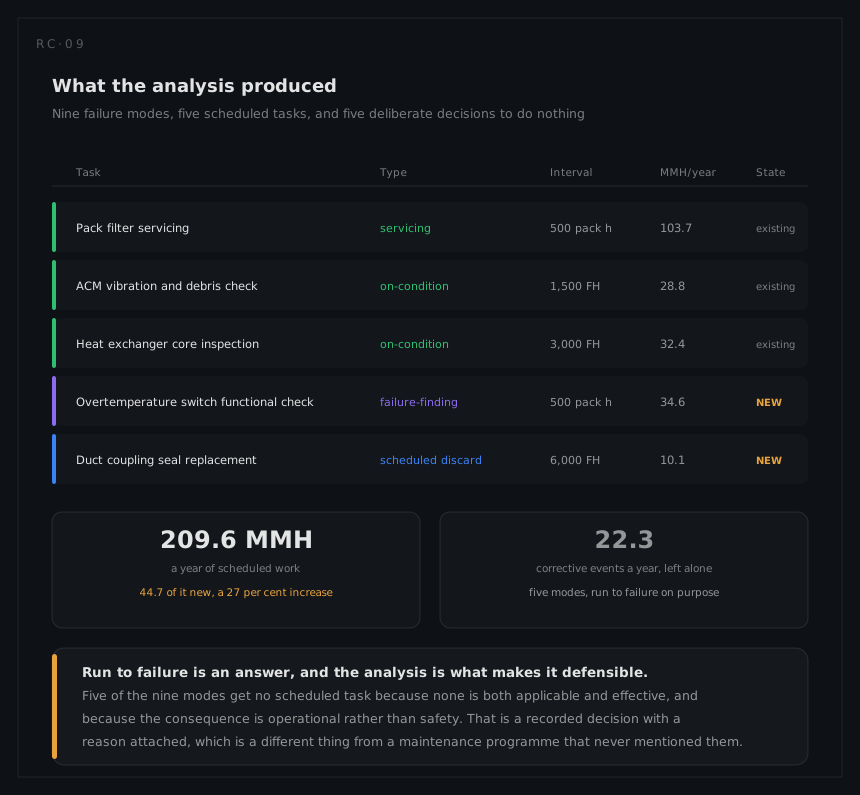
Run-to-failure entries are results, not gaps. Each one records the mode, the consequence category, and the fact that no task was both applicable and effective. On the worked example five of nine modes end here, which is normal and is the reason the programme is affordable.
3. Design requirements
Every mode where the consequence is safety or environmental and no task can be found is a design output, not a maintenance output. So is every case where the arithmetic demands an interval nobody can deliver. These go to the design authority as requirements with the analysis behind them, and they are the highest-value thing an early RCM analysis produces.
4. What the programme costs
Frequency times duration, per task, rolled up. On the worked example the analysis added 44.7 maintenance man-hours a year to a system that was carrying 164.9, a 27 per cent increase, and it can defend every hour of it. The task analysis turns those requirements into hours, people and parts; this module supplies the requirement and the interval.
5. The revision plan
| Trigger | What it invalidates |
|---|---|
| Observed failure rate differs from the assumed one | Every computed interval that used it |
| A P-F interval turns out to be shorter than assumed | The condition-based task built on it, immediately |
| Age exploration produces life data | The intervals that were set conservatively for lack of it |
| The operating context changes | Potentially the consequence categories, and therefore the answers |
| A design change | The mode list, and everything downstream of it |
What the results do not support
- They are not a schedule. Tasks and intervals are inputs to maintenance planning, which packages them into checks against opportunity, access and downtime.
- They are not an availability model. RCM says what work exists; whether the system meets an availability target needs the corrective work, the repair times and the logistics as well.
- They do not make a case for more maintenance. A rigorous analysis usually removes tasks. A result that adds work everywhere is a signal that the effectiveness tests were skipped.
- They are only as good as the mode list. The analysis cannot decide about a failure mode nobody wrote down, which is why it is built on the FMECA rather than on a workshop's memory.
- They expire. Intervals derived from assumed rates are provisional until service data arrives, and an analysis never revisited is a record of what was believed on the day it was signed.