

A fault tree produces four things. Programmes report the first, argue about the second, act on the third, and forget the fourth until an audit asks for it.
1. The number, against the objective it was allocated
| Reported as | Why |
|---|---|
| Probability of the top event, in the same units as the objective | A per-flight number and a per-flight-hour objective are not comparable without the average flight length |
| The approximation used | Rare event sum or exact evaluation; the difference matters at the second digit and the second digit is sometimes the argument |
| The margin | A factor, not a verdict: "1.5E-10 against 2E-9" says more than "compliant" |
A calculated value below its band is compliant, and the bands are read as orders of magnitude rather than as hard edges. What a number cannot do is rescue a structural finding, which is the next output.
2. The minimal cut sets, by order and by contribution
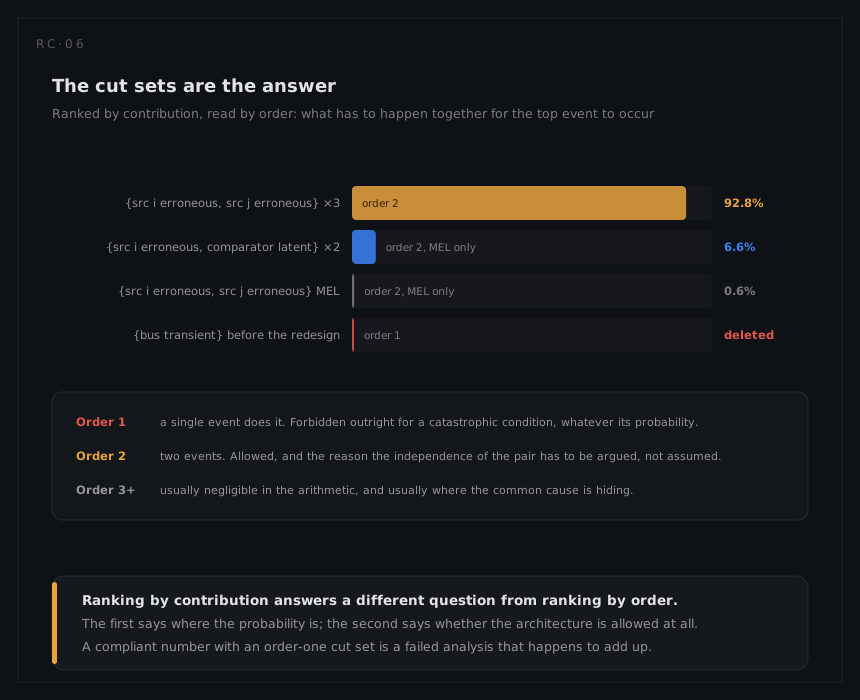
- By order. Any order-one set is a single point of failure, and for a catastrophic condition that is a finding regardless of probability. Order-two sets are independence claims, and each one is a question for the common cause analyses.
- By contribution. The ranking tells a designer where improvement moves the answer, and where it does not. On the worked example, one class of cut set carries 93 per cent and the monitor carries under 7, which is a spending decision handed over ready-made.
Importance measures formalise the second reading. The two in general use answer different questions: Fussell-Vesely asks what share of the top event's probability flows through cut sets containing this event, and Birnbaum asks how much the top event would change if this event's probability moved. The first ranks where the risk is; the second ranks where improvement pays.
3. Requirements the analysis creates
This is the output that changes the product, and it is easy to lose because it does not look like an analysis result:
| Requirement | Where it came from |
|---|---|
| Item failure rate budgets | Allocation down the tree, issued to suppliers before the item exists |
| Architecture constraints | Order-one cut sets, and independence that the tree assumed |
| Test and inspection intervals | Every latent basic event: the interval is now a safety requirement |
| Monitoring and annunciation | Anything whose classification depended on the crew being told |
| Configuration limits | House events: dispatch states the tree was quantified for, and those it was not |
An interval buried in a fault tree and nowhere else is the classic way a compliance argument quietly expires: the maintenance programme is optimised three years later, the interval doubles, and the tree that assumed it is never re-run.
4. The assumptions, in the open
Every conditional probability in an inhibit gate, every independence claim under an AND, every exposure time and its source, and every diamond left undeveloped. The assumptions are not an appendix: on the worked example the compliance case turns entirely on a conditional probability of 0.05, and a report that does not say so has published an unexaminable conclusion.
What the results do not support
- A comparison between two trees built to different boundaries. Resolution, initial state and what counts as external all move the number; two trees of the same system by two organisations are rarely comparable.
- Any claim about a failure condition the tree was not built for. A tree answers one top event. A second condition needs a second tree, quantified from the same data or the safety case contradicts itself.
- A probability for software or requirements errors. They belong in the tree qualitatively, to show where independence rests on development assurance. Attaching a rate to them is not conservatism, it is invention.
- Sequence, repair or reconfiguration. A static tree has no time in it. Where the system changes state during the mission, the honest answer is a Markov model.
- Confidence in a number computed from assumed rates. Handbook rates and engineering judgement produce an argument, not a measurement, and only field data grades it.