

This is row 7 of the functional hazard assessment in the previous module: misleading attitude displayed on both flight displays, unannunciated, classified catastrophic, objective 2 × 10⁻⁹ per two-hour flight. The architecture proposed to meet it has three attitude sources with a two-out-of-three comparison, a comparison monitor in each display computer, and a standby indicator that this tree does not need. All rates are illustrative teaching values.
The inputs
| Basic event | Rate | Exposure | Where it comes from |
|---|---|---|---|
| Attitude source produces erroneous output | 1.5 × 10⁻⁵ per hour | 2 h flight, revealed at once by the vote | Prediction, split by the FMECA's mode ratio |
| Comparison monitor fails passive | 8.0 × 10⁻⁶ per hour | latent: 750 h scheduled test | Prediction; the interval is the maintenance programme's |
| 28 V bus transient corrupts the sources | 3.0 × 10⁻⁵ per hour | 2 h flight | Prediction |
| A transient drives all three sources outside tolerance the same way | 0.01 | conditional | Engineering judgement, not data |
| Two erroneous outputs agree inside the comparator window | 0.05 | conditional | Engineering judgement, not data |
| Dispatch with one source inoperative | 0.02 of departures | configuration | The minimum equipment list |
The agreement probability is the row to watch. It is a conditional probability in an inhibit gate, it is a judgement rather than a measurement, and by the end of this example it will turn out to matter more than any failure rate in the table.
The tree as first drawn
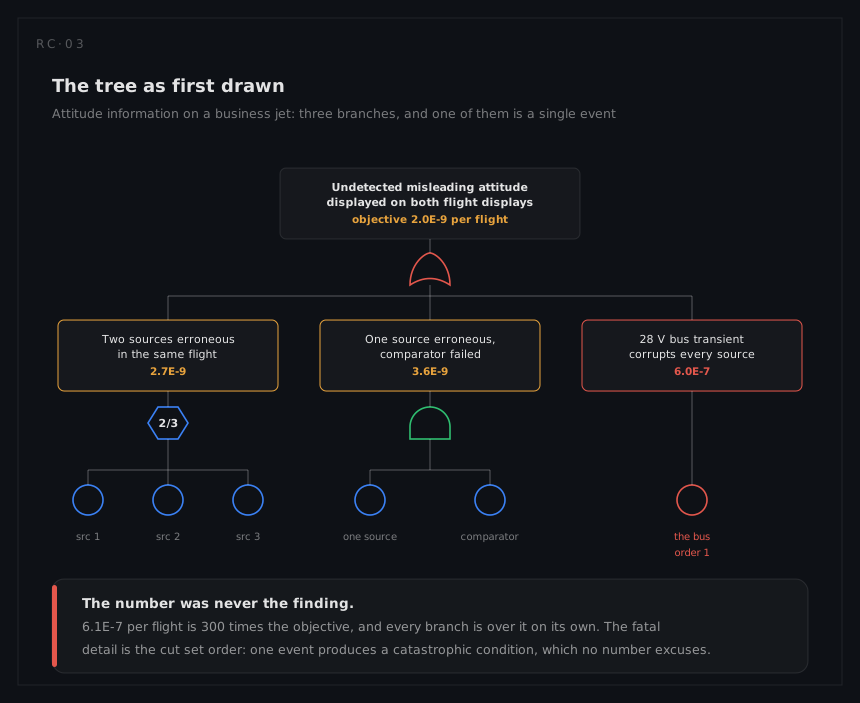
Branch A, two erroneous sources outvoting the healthy one. With three sources and a two-out-of-three comparison, one erroneous source is outvoted and annunciated. Two are not:
P(one source erroneous in a flight) = 1.5 × 10⁻⁵ × 2 = 3.0 × 10⁻⁵
3 pairs × (3.0 × 10⁻⁵)² = 2.7 × 10⁻⁹ per flight
conservatively assuming any two erroneous outputs agree closely enough to win the vote.
Branch B, one erroneous source hidden by a failed comparator. Only reachable when the aircraft is dispatched with a source inoperative, so the comparison is a two-way comparator with nothing to vote. The monitor is latent, tested every 750 hours, and must fail before the source for the error to go unannounced, which is the priority AND:
½ × 8.0 × 10⁻⁶ × 1.5 × 10⁻⁵ × 2 h × 750 h = 9.0 × 10⁻⁸ per MEL flight, per source
× 2 sources × 0.02 of departures = 3.6 × 10⁻⁹ per flight
Branch C, the common cause. All three sources are fed from one 28 V bus in this version of the design. A transient that drives all three outside tolerance in the same direction defeats the vote completely, and the 0.01 declared above is the judged probability that a transient does that rather than something the sources ride out:
3.0 × 10⁻⁵ × 2 h × 0.01 = 6.0 × 10⁻⁷ per flight
Total: 6.1 × 10⁻⁷ per flight, against an objective of 2 × 10⁻⁹. Three hundred times over.
The finding was not the number
The arithmetic says branch C dominates by more than two orders of magnitude, and a programme reading only the number would go looking for a better bus. Read the cut sets instead:
| Cut set | Order | Per flight |
|---|---|---|
{bus transient} | 1 | 6.0 × 10⁻⁷ |
{source i erroneous, source j erroneous}, three of them | 2 | 9.0 × 10⁻¹⁰ each |
{source erroneous, comparator latent}, two of them | 2 | 1.8 × 10⁻⁹ each, on MEL flights |
The first row is a single event that produces a catastrophic failure condition, and the qualitative rule that governs it does not have a probability in it. A bus a hundred times better would still be an order-one cut set and still be non-compliant. The design has to change, and no amount of data improves it.
Three changes
| Change | Kind | Effect on the tree |
|---|---|---|
| Three sources on three separately protected supplies | Architecture | Deletes the order-one cut set; the residue is an order-three coincidence, negligible |
| Comparator proved at every power-up rather than every 750 h | Maintenance and BIT | Latency falls from 750 h to one flight |
| Agreement probability estimated and stated, rather than assumed to be 1 | Analysis | Branch A falls by the factor that is argued, and the argument becomes visible |
The first change is argued rather than calculated. Three independent supply faults in one flight is an order-three coincidence and falls out of the arithmetic, but that is only the independent part. What survives separation is the dependent fraction: shared routing, a shared protection design, one installation error repeated three times. That residue is what a beta-factor term would carry, and its value is settled by the zonal, particular-risk and common-mode analyses rather than by anything in this tree.
The second change is the one worth dwelling on, because it cost almost nothing:
½ × 8.0 × 10⁻⁶ × 1.5 × 10⁻⁵ × 2 h × 2 h = 2.4 × 10⁻¹⁰ per source
× 2 sources × 0.02 = 9.6 × 10⁻¹² per flight
A 375-fold reduction from a test interval, with no new hardware. That is the routine result of taking latency seriously, and it is why the exposure column of a fault tree is worth more attention than the rate column.
The tree after the redesign
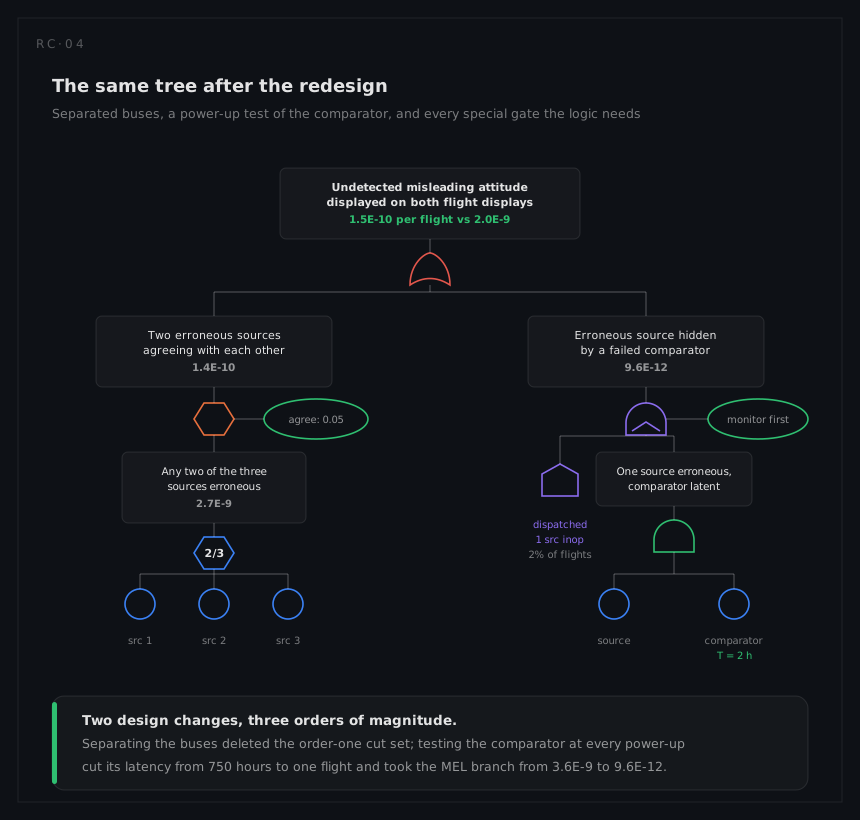
| Branch | Per flight |
|---|---|
| Two erroneous sources, agreeing | 1.4 × 10⁻¹⁰ |
| Erroneous source hidden by a failed comparator, MEL flights only | 9.6 × 10⁻¹² |
| Two erroneous sources agreeing on an MEL flight | 9.0 × 10⁻¹³ |
| Common cause through the supplies | negligible, order three |
| Top event | 1.5 × 10⁻¹⁰ per flight, against 2 × 10⁻⁹ |
Unrounded, branch A is 2.7 × 10⁻⁹ × 0.05 = 1.35 × 10⁻¹⁰, and the third row is the same coincidence on the two sources left after an MEL dispatch: 9.0 × 10⁻¹⁰ × 0.05 × 0.02 = 9.0 × 10⁻¹³. The three quantified rows sum to 1.35 × 10⁻¹⁰ + 9.6 × 10⁻¹² + 9.0 × 10⁻¹³ = 1.455 × 10⁻¹⁰, so 1.455 × 10⁻¹⁰ ÷ 2 h = 7.3 × 10⁻¹¹ per flight hour: comfortably inside the catastrophic band, with better than a factor of thirteen in hand.
The FHA recorded a twenty-second at-risk window against this failure condition. That window does not change the budget, which is per flight either way. It changes the rate an item supplier can be given, because an item whose failure only matters inside the window is at risk for twenty seconds rather than two hours. This tree is quantified over the whole flight, which is the conservative direction, and the window is left where it belongs: in the supplier requirement rather than in the compliance total.
Where the number actually comes from
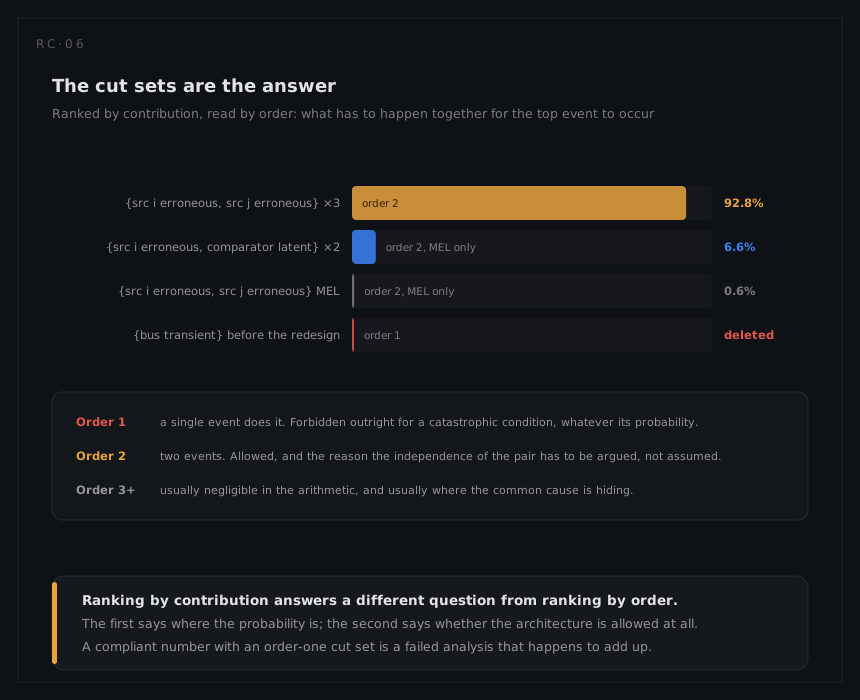
| Cut set class | Share | Per flight |
|---|---|---|
| Two sources erroneous and agreeing | 92.8% | 1.4 × 10⁻¹⁰ |
| Source erroneous with the comparator latent, MEL only | 6.6% | 9.6 × 10⁻¹² |
| Two sources erroneous on an MEL flight | 0.6% | 9.0 × 10⁻¹³ |
Every surviving cut set contains an erroneous attitude source, so that mode's Fussell-Vesely importance is 1.00: nothing else in the model can produce the top event on its own terms. The comparator's is 0.066, under seven per cent, which is worth knowing before anybody spends money making it better.
The assumption the compliance case rests on
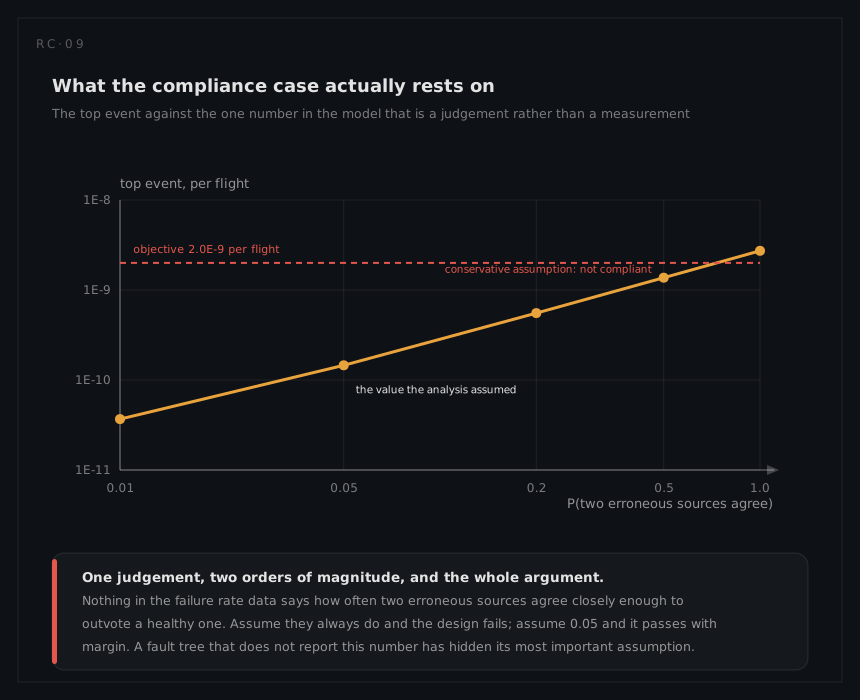
| P(two erroneous outputs agree) | Top event, per flight | Verdict |
|---|---|---|
| 0.01 | 3.7 × 10⁻¹¹ | compliant |
| 0.05, assumed | 1.5 × 10⁻¹⁰ | compliant, 13× margin |
| 0.2 | 5.5 × 10⁻¹⁰ | compliant, 3.6× margin |
| 0.5 | 1.4 × 10⁻⁹ | marginal |
| 1.0, fully conservative | 2.7 × 10⁻⁹ | not compliant |
This is the honest ending of most real fault trees. The failure rates are traceable, the logic is checkable, the arithmetic is elementary, and the answer swings by two orders of magnitude on one conditional probability that is an argument rather than a measurement. Reporting that number, and the reasoning behind it, is not a caveat: it is the main result. A tree that buries it in a spreadsheet cell has published a conclusion whose foundation nobody can examine.
What the analysis leaves behind
| Output | Owner |
|---|---|
1.5 × 10⁻¹⁰ per flight against a 2 × 10⁻⁹ objective, with its cut sets | The certification file |
| Three separately protected supplies, one per source | The architecture, as a safety requirement |
| Power-up test of each comparison monitor | Built-in test specification, and testability |
| An agreement probability of 0.05, with the study that supports it | An open item until the study exists |
Source erroneous-output rate 1.5 × 10⁻⁵ per hour | The supplier requirement, and what field data will grade |