

Safety's mathematics has an awkward job: it must combine a quantity that is often measurable (how often something fails) with a quantity that is never measurable (how bad the outcome would be), and produce a decision that a regulator, a court, or a bereaved family might one day examine. Every framework in this chapter is an attempt to do that honestly. They differ in vocabulary and in industry, and they agree on far more than their notation suggests: classify the consequence, bound the likelihood, demand more rigour as the consequence worsens, and never let a single failure produce a catastrophe.
Notation used in this topic
| Symbol | Reads as | Meaning |
|---|---|---|
| RAC | risk assessment code | one severity category paired with one probability level |
| DAL | development assurance level | the aviation ladder, A (most severe) to E |
| FDAL, IDAL | function and item DAL | the level carried by a function, and by each item implementing it |
| SIL | safety integrity level | the functional safety ladder, SIL 1 to SIL 4 |
| ASIL, QM | automotive SIL, quality management | the automotive ladder, determined from severity, exposure and controllability |
| THR | tolerable hazard rate | the railway expression of an integrity target, per hour |
| PFD, PFH | probability of failure on demand, per hour | the low-demand and high-demand target measures |
λDU, T | dangerous undetected rate, proof-test interval | the two terms behind the λT/2 approximation and behind its exact form |
Tlife | life exposure | the interval at which an uncovered dangerous failure is finally found: overhaul, replacement or end of life |
| MooN | M out of N | the vote: M of the N channels suffice to perform the safety action |
| β | beta factor | the share of a channel's rate attributed to causes that defeat every channel at once. Distinct from the Weibull shape parameter β in the life models and from the conditional probability β of MIL-STD-1629A Task 102: three quantities, one letter, and the context always says which |
| ALARP, SFAIRP | as low as reasonably practicable | the duty to reduce risk short of gross disproportion |
| CCA, ZSA, PRA, CMA | common cause analysis and its triad | zonal, particular risks and common mode studies |
Every abbreviation used anywhere in RAMS Core is defined in the glossary.
Risk: two dimensions, one decision
Risk is the pairing of severity and likelihood, and the discipline's first move is always to put both on a defined scale so that different hazards can be compared by different people and reach the same answer.
The defence standard practice for system safety (MIL-STD-882E) gives the canonical four-level severity scale, defined by the worst credible outcome of the potential mishap:
| Severity | Category | The consequence that defines it |
|---|---|---|
| Catastrophic | 1 | Death, permanent total disability, irreversible significant environmental impact, or loss above the standard's top monetary threshold |
| Critical | 2 | Permanent partial disability, injuries or illness hospitalising at least three people, reversible significant environmental impact, or major monetary loss |
| Marginal | 3 | Injury or illness causing lost work days, reversible moderate environmental impact, or moderate monetary loss |
| Negligible | 4 | Injury or illness not causing a lost work day, minimal environmental impact, or minor monetary loss |
and a six-level probability scale from Frequent (A) through Probable (B), Occasional (C), Remote (D) and Improbable (E) to Eliminated (F), the last being reserved for hazards that have been designed out entirely. The pairing of one severity with one probability is a Risk Assessment Code, and a matrix maps every code onto a risk level of High, Serious, Medium or Low, which in turn determines who is allowed to accept it. That last link is the point of the whole apparatus: the matrix is not a calculator, it is a routing table that sends each hazard to the right decision-maker.
Two properties of the scales repay attention. Severity is assessed on the worst credible outcome, not the average one, because averaging consequence across scenarios is how a catastrophic hazard gets diluted into a marginal one on paper. And the probability scale is explicitly qualitative-if-necessary, quantitative-if-possible: where real rate data exists the standard prefers it, and the Improbable band is conventionally anchored around a one-in-a-million order of magnitude, but a scale that forces invented numbers produces false precision rather than insight.
Reading a risk matrix honestly
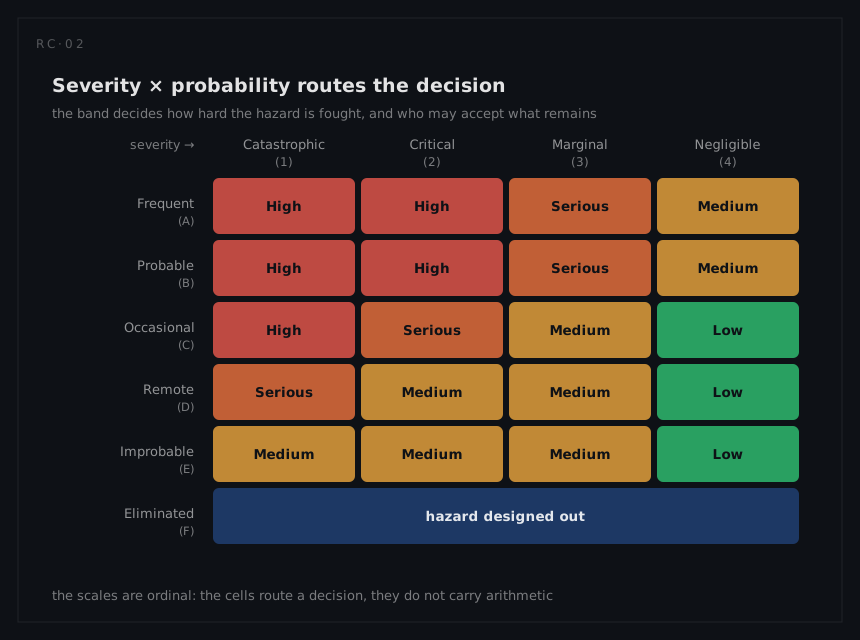
The matrix is the most widely used and most widely abused instrument in the discipline, so its limits belong in the foundations rather than in a footnote:
- The scales are ordinal, not arithmetic. Severity 2 is not "twice" severity 4, and probability C is not a number. Multiplying category indices to get a "risk score", then averaging or summing those scores across hazards, is arithmetic on labels and produces conclusions the inputs cannot support.
- Bands compress enormous ranges. A single probability band can span two orders of magnitude; two hazards in the same cell can differ in real risk by a factor of a hundred.
- The colouring encodes a policy, not a physical fact. Where the boundary between Serious and Medium falls is an organisational risk-appetite decision that the matrix silently naturalises. Different sectors draw it differently, and correctly so.
- Matrices tempt severity deflation. Because a Catastrophic assessment triggers the most expensive obligations and the most senior acceptance, there is chronic organisational pressure to argue a hazard down one category. The countermeasure is procedural: severity is assigned from the consequence definitions before any mitigation is considered, and mitigation moves the probability, not the severity, unless the design genuinely changes what happens.
Used properly, the matrix is excellent at what it is for: triaging a large hazard inventory quickly, forcing an explicit consequence judgment, and routing acceptance authority. It is not a quantitative risk assessment, and the frameworks in the next sections exist because for the highest-consequence hazards, "High risk, needs work" is not a sufficient answer.
Quantitative targets: the inverse relationship
Where consequences are severe enough and the industry mature enough, qualitative bands give way to numerical probability targets, built on a principle every sector states in almost identical words: the more severe the consequence, the less frequently it may be permitted to occur.
Civil aviation gives the most fully worked example, set out in the airworthiness authorities' guidance on system design and analysis. Failure conditions are classified by the severity of their effect on aeroplane and occupants, from No Safety Effect through Minor, Major and Hazardous to Catastrophic, and each class carries an average probability per flight hour it must not exceed, stepping by roughly two orders of magnitude per class down to the famous 10⁻⁹ per flight hour for catastrophic failure conditions. The number is not arbitrary and its derivation is instructive: starting from the historical accident rate for large transport aircraft, allocating the portion of that rate attributable to systems, and dividing it among the order of a hundred potential catastrophic failure conditions in a modern aeroplane, one arrives at a per-condition budget in the region of one in a billion flight hours. It is a budget allocation, exactly like the reliability allocation in this knowledgebase, with the top-level number set by what society has come to expect of air travel.
That target comes with a qualitative partner requirement that matters just as much: catastrophic failure conditions must not result from a single failure. The probability arithmetic and the no-single-point rule work together, because a lone number can always be argued down with optimistic data, while a structural rule about cut-set order cannot.
| Aviation failure-condition class | Effect, in the regulatory language | Order-of-magnitude probability target per flight hour |
|---|---|---|
| Catastrophic | Loss of the aeroplane, multiple fatalities | 10⁻⁹ |
| Hazardous (Severe-Major) | Large reduction in safety margins, serious or fatal injury to a small number of occupants | 10⁻⁷ |
| Major | Significant reduction in safety margins, discomfort or injuries to occupants | 10⁻⁵ |
| Minor | Slight reduction in safety margins, routine crew action | 10⁻³ |
| No safety effect | No effect on operational capability or safety | No requirement |
Railway practice expresses the same idea as a Tolerable Hazard Rate: a permitted rate of occurrence per hour for each identified hazard, apportioned down from a system-level safety target, with the deepest integrity band conventionally covering the 10⁻⁹ to 10⁻⁸ per hour region. Process and machinery sectors express it as the required risk reduction between the unprotected process risk and the tolerable risk. Different units, one grammar.
Integrity levels: the ladders
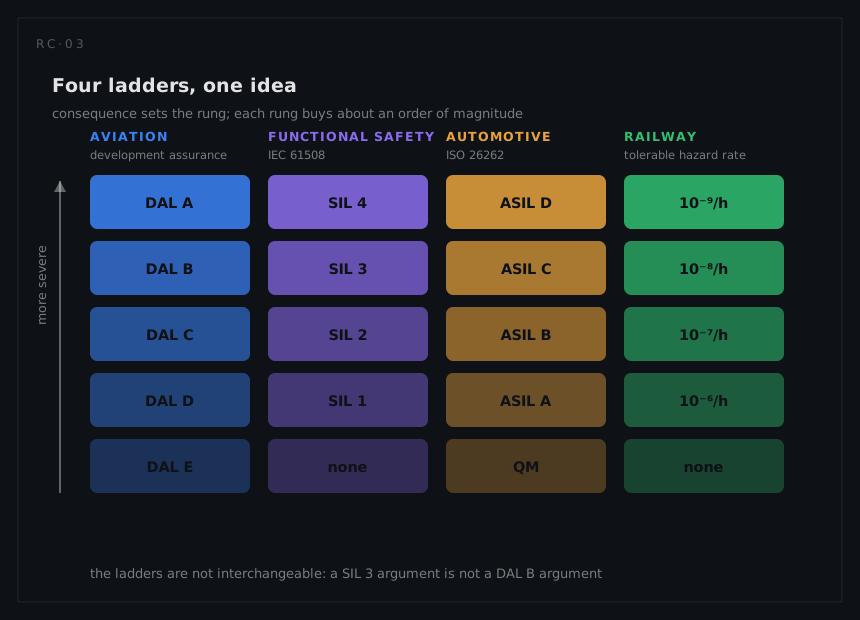
Once the consequence classification exists, every sector attaches to it a level that governs how much rigour the design and its evidence must carry. The four best known:
| Framework | Levels | Anchored on | What the level actually demands |
|---|---|---|---|
| Aviation development assurance (the ARP4754 lineage) | DAL A (most severe) to DAL E | Failure condition classification | Rigour of the development process for the function and its items: requirements, verification, independence of review |
| Functional safety (IEC 61508) | SIL 1 to SIL 4 | Required risk reduction | A probability target band plus systematic capability and architectural constraints |
| Automotive (ISO 26262) | QM, ASIL A to ASIL D | Severity, exposure and controllability, combined through a determination table | Process rigour and technical measures across the automotive safety lifecycle |
| Railway (EN 50126/50129 family) | SIL 1 to SIL 4 with tolerable hazard rates | Apportioned hazard rate | Quantified THR for random failures plus process requirements for systematic ones |
The functional safety ladder is the one with the crispest numbers, because it separates the two failure classes explicitly. For a protective function operating in low demand mode (it sits dormant and is called on rarely), the level is defined by bands of average probability of dangerous failure on demand: each SIL step is one order of magnitude, with SIL 4 the most demanding band and SIL 1 the least. For functions in high demand or continuous mode, the same ladder is expressed as an average frequency of dangerous failure per hour instead. The low-demand quantity is exactly the on-demand unavailability from the availability foundations, which is why proof-test intervals appear inside safety integrity calculations.
The automotive ladder is the one with the most interesting anchoring: rather than starting from a probability target, it derives the required level from three factors assessed per hazardous event: severity of harm, exposure (how much of the time the operational situation occurs), and controllability (whether a typical driver can act to avoid the harm). Combining the three through the standard's determination table lands the event on QM (quality management measures suffice) or on ASIL A through D; the classes are ordinal labels looked up in a table, never multiplied. It is a more honest reflection of how automotive risk actually works, where the same failure is trivial in a car park and lethal at motorway speed.
Two warnings about ladders. First, the levels do not translate between sectors: a SIL 3 argument is not a DAL B argument wearing different clothes, and cross-mapping tables between frameworks (which circulate widely) are conveniences, not equivalences. Second, and more fundamentally, a level is not a measurement of the delivered product. Assigning DAL A or SIL 3 to a function specifies how carefully it must be developed and evidenced; it does not by itself demonstrate that the resulting item is that good.
Random failures and systematic failures
Underneath every framework above lies the distinction that shapes modern safety practice more than any other:
| Random hardware failures | Systematic failures | |
|---|---|---|
| Origin | Physical degradation of components in service | Errors designed or built in: specification, design, software, manufacture, procedure |
| Behaviour | Occur at a rate; statistically predictable in populations | Present from the start; occur whenever the triggering conditions arise |
| Can you compute a probability? | Yes, from prediction and field data | No, in any defensible way |
| How you fight them | Redundancy, margin, monitoring, proof testing | Process rigour, independence, verification, simplicity, review |
This is why software has no failure rate. A program does not wear out; it does exactly what it was written to do, and its "failures" are latent design errors waiting for the input that reveals them. No amount of running time gives a meaningful statistical basis for claiming a software function will fail less than once per billion hours. The discipline's response was to stop trying: instead of predicting the probability of a systematic error, the frameworks regulate the rigour of the process in proportion to the consequence, which is precisely what a DAL, an ASIL or the systematic-capability half of a SIL is.
The defence standard practice takes the same route with a different mechanism, and it is a neat illustration of the logic. Instead of asking how likely a software function is to fail, it asks two answerable questions: how severe would the resulting mishap be, and how much control does the software actually have over the hazardous outcome (from fully autonomous authority, through arrangements where independent mechanisms or an operator can intervene, down to software that merely displays information or has no safety impact). Crossing those two answers produces a software criticality index, which in turn prescribes a level of rigour: which analyses and which depth of safety-specific testing must be performed. The standard is careful to note that this criticality index is not itself a risk assessment; it is a specification of the work needed to make a risk assessment credible.
Tolerability: how safe is safe enough
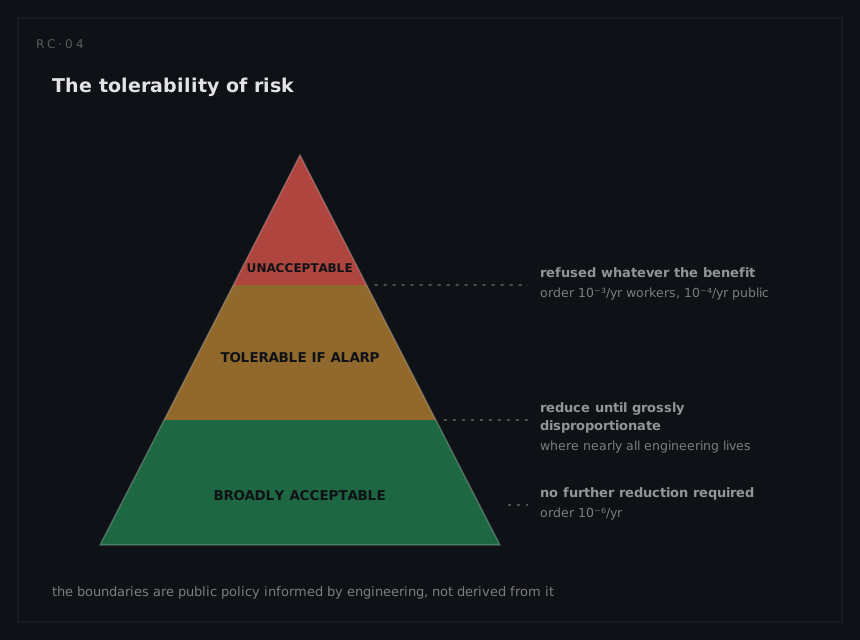
Every quantitative target eventually rests on a societal judgment, and the UK regulatory tradition articulated it most explicitly in a framework that has since been borrowed worldwide. Its legal root is the duty to reduce risk so far as is reasonably practicable, and the classic judicial interpretation established the shape of the test: the duty holder must weigh the risk against the sacrifice (in money, time or trouble) needed to avert it, and must act unless there is a gross disproportion between them, with the burden of proof on the duty holder. The disproportion is deliberately asymmetric: a mere balance of cost against benefit is not enough to justify inaction.
The regulator's tolerability framework turns that test into three regions:
- Unacceptable. Risk above this line is refused irrespective of benefits, and the published guidance frames the boundary in terms of individual risk of death per year, at an order of magnitude around one in a thousand per year for workers and one in ten thousand per year for members of the public.
- Tolerable, subject to reduction. The broad middle, where risk is accepted only in return for benefit and only if it has been driven down as far as reasonably practicable. This is where nearly all real engineering lives, and it is why safety arguments must document what was considered and rejected, not merely what was done.
- Broadly acceptable. Below an order of magnitude around one in a million per year, further reduction is not normally required, though good practice still applies.
Three consequences for practice. ALARP is an argument, not a calculation: the deliverable is a documented demonstration that credible further measures were identified and shown to be grossly disproportionate, and a bare assertion is worthless. Good practice sets a floor: where established practice exists (codes, standards, sector norms), meeting it is normally the minimum, and a cost argument does not excuse falling below it. And the units must survive the argument: individual risk per year, societal risk over a population, and per-hour or per-demand failure rates are different quantities, and sliding between them is the most common way a tolerability argument quietly breaks.
Exposure, units, and the arithmetic that connects them
The final piece of the mathematics is the least glamorous and the most frequently botched: converting between the rates the engineering produces and the risk the tolerability judgment consumes. A hazardous failure rate is not a risk until it has been through three multiplications:
risk of harm = failure rate × exposure to the hazardous state × probability the exposure produces harm
Each factor is its own analysis. The rate comes from the reliability chain. The exposure is how long the system spends in the state where the failure matters (an aircraft's approach phase, a level crossing's occupancy, the fraction of driving time at motorway speed, which is exactly the automotive exposure parameter). And the conditional probability of harm covers whether someone is present, whether they can escape, and whether protection or an operator intervenes: the controllability factor by another name. Skipping the middle and last terms turns every failure into a fatality and produces safety cases nobody believes; assuming them optimistically produces safety cases nobody should believe.
The dormant-function correction from the availability book belongs here too, because most protective functions are dormant. A protection channel whose dangerous failures are undetected, arriving at rate λDU and cleared by a proof test every T hours, is on average halfway through its exposure window when a demand arrives, so its average probability of failure on demand is
PFDavg ≈ λDU·T/2
and that probability, multiplied by the demand rate, is the frequency of the unprotected event. Test interval, detection coverage and redundancy therefore sit inside the safety arithmetic, not beside it.
Six of the eight example pages in this topic run that multiplication: the ram air turbine at 9.0 × 10⁻³, the level crossing's proving switch at 9.7 × 10⁻⁴, the vehicle's backup hydraulic path at 5.0 × 10⁻³, the infusion pump's air-in-line detector, the diesel's surveillance interval at 1.6 × 10⁻², and the compressor's shutdown valve, where the interval rather than the hardware sets the integrity level. It is the most-used expression in the topic, and it is an approximation to a particular model of a particular architecture. The three sections that follow are its fine print.
What λT/2 assumes, and where it breaks
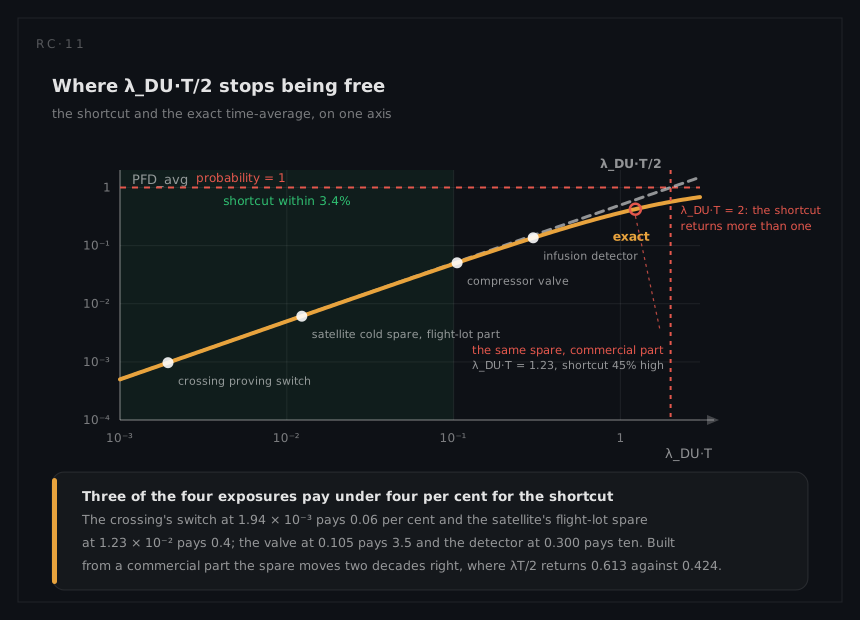
The expression is the time-average of a probability that climbs from zero immediately after a test to λDU·T immediately before the next one. Four conditions have to hold before that average is the right number:
| Condition | What it requires | What happens without it |
|---|---|---|
λDU·T ≪ 1 | The channel is very unlikely to have failed by the end of an interval, so the ramp is effectively linear | The linear ramp overstates a saturating curve, and above λDU·T = 2 the expression returns a number greater than one |
| A perfect proof test | The test reveals every dangerous undetected failure, CPT = 1 | The uncovered fraction is exposed for the life of the plant rather than for the interval, and no test frequency reaches it |
| Perfect repair, negligible outage | The test restores the channel to as-new, instantly, and does not itself take the function out of service | Add the test outage as its own term, τ/T, as the diesel page does with two hours in 730 |
| A single channel | One string, no vote, no shared cause with anything else | The voted expressions apply, and the common-cause term they carry dominates them |
Two silent assumptions ride underneath. The rate must be constant: a wearing item's hazard climbs across the interval, so the average is no longer at the midpoint, which is why the compressor's Weibull hot section is a demand-rate model and not a PFD one. And demands must be uniformly distributed relative to the test schedule: a function proof tested immediately before the operation that is most likely to demand it does not see the average, it sees the freshly tested end of the ramp, and a function tested on a calendar while demands cluster seasonally does not see it either.
Take the first condition off and the exact result is available in closed form. Averaging 1 − e^(−λDU·t) over one interval gives
PFDavg = 1 − (1 − e^(−λDU·T))/(λDU·T)
which is the form the satellite's cold spare falls back on once its exposure is tested against a commercial-grade part rate. Expanding it recovers the shortcut and prices the error:
PFDavg = (λDU·T/2)·(1 − λDU·T/3 + …)
so λT/2 runs high by roughly λDU·T/3 in relative terms: below λDU·T = 0.1 that is under 3.4 per cent and the shortcut is free, by λDU·T = 0.3 it is ten per cent, and at λDU·T of order one it is a different number altogether. Four exposures already quantified in this book, worked both ways:
| Where it appears | λDU·T | λDU·T/2 | Exact | The shortcut runs |
|---|---|---|---|---|
| Level-crossing proving switch, 90-day test | 1.94 × 10⁻³ | 9.72 × 10⁻⁴ | 9.71 × 10⁻⁴ | 0.06% high |
| Compressor shutdown valve, annual full stroke | 0.105 | 5.26 × 10⁻² | 5.08 × 10⁻² | 3.5% high |
| Infusion detector missed by the set-up check | 0.300 | 0.150 | 0.136 | 10% high |
| Satellite cold spare, seven-year exposure, flight-lot part | 1.23 × 10⁻² | 6.13 × 10⁻³ | 6.11 × 10⁻³ | 0.4% high |
| The same spare built from a commercial-grade part | 1.23 | 0.613 | 0.424 | 45% high |
Read the last two rows together. They are the same item, the same seven-year exposure and the same arithmetic, separated only by a hundredfold difference in the part rate: at flight-lot rates the shortcut is free, and at commercial rates it would have claimed 0.613 for a quantity whose true value is 0.424, and would have crossed one entirely had the mission been fourteen years rather than seven. The valve's 3.5 per cent does not move its verdict (5.3 × 10⁻² against 5.1 × 10⁻², both outside the SIL 2 band by a similar margin), and the detector's ten per cent does not move its bracket. The practical rule is therefore not "always use the exact form" but "compute λDU·T first, and only then choose": the product is one multiplication, and it is the multiplication that tells you whether the next one is legitimate.
Proof-test coverage: the fraction the test never reaches
The second condition is the one nobody writes down. A proof test reveals the dangerous failures it is capable of stimulating, and no test stimulates all of them. A full valve stroke proves the stem moves and says nothing about a seat that will not seal against differential pressure. A functional check on a protection channel exercises the trip path and not the input conditioning that only misbehaves at the extremes of range. The fraction of λDU that the test actually reveals is the proof-test coverage CPT, and the uncovered remainder is not on the test interval's clock at all: it accumulates until an overhaul, a replacement, a real demand or the end of life finds it. Splitting the rate between the two clocks:
PFDavg = λDU·(CPT·T/2 + (1 − CPT)·Tlife/2)
The first term is the familiar expression with a smaller rate in it. The second is a rate exposed for a duration nobody chose deliberately.
Work it on the compressor's shutdown valve, where λDU = 12 per 10⁶ hours and the full stroke is annual. Suppose the stroke reveals 95 per cent of the dangerous undetected rate and the remainder waits for the four-yearly turnaround, when the valve is stripped, so Tlife = 4 × 8,760 = 35,040 hours:
PFDavg = 12 × 10⁻⁶ × (0.95 × 4,380 + 0.05 × 17,520) = 12 × 10⁻⁶ × (4,161 + 876) = 6.04 × 10⁻²
against 5.26 × 10⁻² for a perfect test. A five per cent hole in the test adds fifteen per cent to the answer, and the leverage is visible in the bracket: the uncovered fraction sits for Tlife/2, four times as long as T/2, so it enters weighted 0.05 × 4 = 0.20 against the covered fraction's 0.95, and 0.95 + 0.20 = 1.15.
The behaviour that matters is what happens when the interval is shortened, because shortening the interval is the move that page makes. It asks what test frequency would bring the valve to the top of the SIL 2 band and gets 1,667 hours. Run the same interval with 95 per cent coverage:
PFDavg = 12 × 10⁻⁶ × (0.95 × 833.5 + 0.05 × 17,520) = 12 × 10⁻⁶ × (791.8 + 876) = 2.00 × 10⁻²
twice the target rather than at it, and the uncovered term is now the larger of the two. Drive T towards zero and the expression does not go to zero. It goes to
λDU·(1 − CPT)·Tlife/2 = 12 × 10⁻⁶ × 0.05 × 17,520 = 1.05 × 10⁻²
Five per cent of uncovered dangerous failures puts this valve outside the SIL 2 band whatever the test schedule, because the floor is set by the overhaul interval and by nothing the maintenance planner controls. A test-frequency argument can only work on the fraction the test reaches; the rest is answered by changing the test, changing the item, or replacing it sooner.
The same expression sharpens the infusion pump's bracket, which contrasts a daily set-up check at 1.44 × 10⁻³ with an annual service at 0.15 and calls the gap a factor of 104. That gap assumes the check is perfect. Put 90 per cent coverage through the two clocks instead, with the missed tenth waiting for the annual service:
PFDavg = 120 × 10⁻⁶ × (0.9 × 12 + 0.1 × 1,250) = 120 × 10⁻⁶ × 135.8 = 1.63 × 10⁻²
The clock has to be declared before that sum means anything. The daily set-up interval is carried here as 24 operating hours, an upper bound on a pump that averages under seven hours of use a day, while the annual service sits at the pump's 2,500 operating hours. Put both terms on the running clock instead, so that the daily interval becomes 6.85 hours, and the answer is 1.54 × 10⁻²: the same conclusion, reached with the more generous assumption above.
The tenth the check misses contributes 125 hours of exposure against the covered nine-tenths' 10.8, eleven and a half times as much, and the daily check delivers 1.63 × 10⁻² rather than the 1.44 × 10⁻³ a coverage-free reading of the interval promises. Coverage and interval multiply, and quoting one without the other is how a protective function acquires an integrity claim it does not have.
One distinction is routinely lost, and the same percentage means opposite things on either side of it. Proof-test coverage is not diagnostic coverage. The compressor's partial stroke is credited as an automatic diagnostic at 88 per cent, which moves rate out of λDU altogether and into the detected population, where it reappears as λDD × MTTR rather than vanishing: here 10.56 × 10⁻⁶ × 6 = 6.3 × 10⁻⁵, negligible against 6.3 × 10⁻³, which is why the energy page omits it for the valve and carries it for the logic solver. Put the identical 88 per cent through the proof-test expression instead, where it moves no rate anywhere and merely splits λDU between a short clock and a long one:
PFDavg = 12 × 10⁻⁶ × (0.88 × 4,380 + 0.12 × 17,520) = 12 × 10⁻⁶ × 5,956.8 = 7.15 × 10⁻²
worse than the 5.26 × 10⁻² the valve started at, and eleven times worse than the diagnostic reading of the same number. A supplier figure quoted as "coverage" can mean either, and which one it is belongs in the same sentence as its value, exactly as the testability chapter requires of every coverage claim.
Voted architectures, and the floor the beta factor puts under them
Everything above describes one channel. Protective functions are rarely built that way, and this topic's own examples are not: the compressor votes three vibration sensors two out of three, the crossing's vital processor pair must both agree before a train is permitted, 2oo2 to permit and therefore 1oo2 toward the safe state, the vehicle decomposes onto two paths, and the plant has two diesel trains of which either suffices. The notation is MooN, meaning that M of the N channels suffice to perform the safety action. Read it in the direction of the safety action, never in the direction of the hardware: a 1oo2 acts if either channel demands it, which is good at not failing to act and bad at not acting spuriously, a 2oo2 requires both and is the reverse, and 2oo3 sits between them. Which arrangement is the safe one depends entirely on which failure direction is worse, which is the question the overview put as the two faces of a safety requirement.
The simplified low-demand expressions the IEC 61508 tradition standardises follow directly. For identical dormant channels, all proof tested at the same interval T, with β the share of λDU attributed to causes that defeat every channel at once:
| Architecture | Acts when | PFDavg | On the compressor valve, β = 0.05 |
|---|---|---|---|
| 1oo1 | the single channel acts | λDU·T/2 | 5.26 × 10⁻² |
| 2oo2 | both channels act | λDU·T | 1.05 × 10⁻¹ |
| 1oo2 | either channel acts | ((1 − β)·λDU·T)²/3 + β·λDU·T/2 | 5.95 × 10⁻³ |
| 2oo3 | any two of the three act | ((1 − β)·λDU·T)² + β·λDU·T/2 | 1.26 × 10⁻² |
Three features of the algebra are worth naming before the numbers. The 2oo3 independent term is exactly three times the 1oo2 term because there are three ways to lose two channels out of three. The 2oo2 term is twice the single channel because either channel failing dangerously defeats the function, which is a series arrangement wearing a vote's notation. And the 1oo2 independent term is (λDU·T)²/3, not the (λDU·T/2)² that multiplying two average PFDs would give: the channels are tested together, so their unavailabilities climb in step, and the average of the product is four thirds of the product of the averages. Assuming the pair's two failures are independent draws, when in fact they share a clock, understates the pair by that factor before any common cause is considered.
Now the arithmetic, on the valve at λDU = 12 per 10⁶ hours, T = 8,760 hours and the β = 0.05 that the diesel pair uses:
λDU·T = 12 × 10⁻⁶ × 8,760 = 0.1051
PFD1oo2 = (0.95 × 0.1051)²/3 + 0.05 × 5.26 × 10⁻² = 3.32 × 10⁻³ + 2.63 × 10⁻³ = 5.95 × 10⁻³
A second valve buys a factor of 8.8 on the single one. Set that beside what that page already found without adding hardware: quarterly partial stroke bought a factor of 8.3, for an instrument air line and a procedure. The duplicate buys the same factor for the price of a second valve, a second actuator, a second proof test and a second set of shared causes.
The two terms then part company, because the independent term is quadratic in λDU·T and the common-cause term is linear. Improving the channel attacks only one of them. Cut λDU by a factor of ten:
λDU | 1oo1 | 1oo2 independent term | 1oo2 β term | 1oo2 total | Factor the pair buys |
|---|---|---|---|---|---|
| 12 per 10⁶ h | 5.26 × 10⁻² | 3.32 × 10⁻³ | 2.63 × 10⁻³ | 5.95 × 10⁻³ | 8.8 |
| 1.2 per 10⁶ h | 5.26 × 10⁻³ | 3.32 × 10⁻⁵ | 2.63 × 10⁻⁴ | 2.96 × 10⁻⁴ | 17.8 |
| 1.2 per 10⁶ h, β = 0 | 5.26 × 10⁻³ | 3.68 × 10⁻⁵ | 0 | 3.68 × 10⁻⁵ | 143 |
A tenfold better channel would have left the ideal pair 143 times better than its own single channel and leaves the real pair only 17.8 times better, and the common-cause term has grown from 44 per cent of the answer to 89 per cent of it. The limit is exact and worth carrying: since PFD1oo2 ≥ β·λDU·T/2, a pair of identical channels can never beat its own single channel by more than 1/β, which at β = 0.05 is a factor of 20, and the ten-times-better channel has already spent 17.8 of it. This is the redundancy ceiling of the reliability systems chapter restated in PFD currency. It is also why the diesel pair gains more from cutting β by a factor of five, from 0.05 to 0.01, than from a third identical train: the asymptote moves from 1.3 × 10⁻³ to 2.67 × 10⁻⁴, and no channel count reaches either.
Three riders on the table, each of which changes an answer in practice.
Staggering the tests is free. The expressions assume every channel is tested at the same moment. Offset the two tests of a 1oo2 by half an interval and the channels are never simultaneously fresh or simultaneously stale; the independent term falls from (λDU·T)²/3 to 5(λDU·T)²/24, five-eighths of its value, for no hardware and no additional tests. The condition on that result is worth stating: the β term is conventionally held at β·λDU·T/2 on the ground that testing and repairing one channel does not remove the cause that failed both. A model in which staggered testing does clear the shared cause would halve it to β·λDU·T/4, and which of the two applies is a judgement about the cause, not about the schedule.
Asymmetric pairs are not in the table. The 1oo2 expression assumes two dormant channels on the same clock. Where one channel operates continuously and the other is dormant, as on the vehicle, the combination is not a PFD at all: it is the operating channel's failure frequency multiplied by the dormant channel's PFD, giving a rate per year rather than a dimensionless probability, which is exactly what that page computes and why its answer is quoted per vehicle-year.
The β is a judgement, and it is the load-bearing one. The diesel page moves its pair by 63 per cent on a change in β and by seven per cent on the bound of a probability measured over 6,000 demands. That asymmetry is why the functional safety framework refuses to grant an integrity level on PFD arithmetic alone and imposes architectural constraints as well, requiring a minimum hardware fault tolerance for a given claim. It is a structural rule of the same kind as civil aviation's prohibition on order-one cut sets for a catastrophic failure condition, and for the same reason: a number can be argued down with optimistic data, and a rule about structure cannot. What makes a low β defensible in the first place is the subject of the systems chapter.