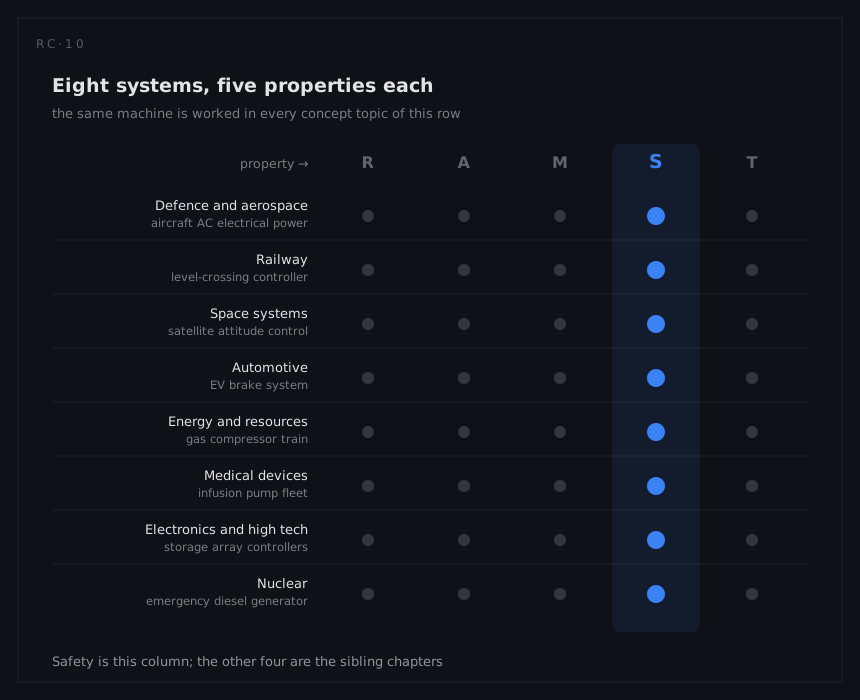
A hazard is always a hazard of something. This chapter takes eight systems, one from each industry the platform serves, and works the safety question on each of them: what harm the machine can do, how that consequence was classified, what target the classification bought, and what the architecture had to look like before anyone was entitled to quote a probability at all.
The eight systems are the same in every concept topic of this row. The aircraft electrical system worked here for its catastrophic failure condition is the one worked in reliability for its failure rates, in maintainability for its repair times, in availability for its dispatch rules and in testability for its built-in test coverage. Read a column and you learn one property across eight industries; read a row and you watch one machine reveal its five RAMS faces. Every number below is illustrative, invented for teaching and chosen to keep the arithmetic legible; none of it is field data from any real product, and no certification rule quoted here applies outside the sector that wrote it.
| Industry | The example system |
|---|---|
| Defence and aerospace | Transport aircraft AC electrical power generation and distribution |
| Railway | Wayside level-crossing controller |
| Space systems | Earth-observation satellite attitude control |
| Automotive | Electric vehicle brake system with regenerative blending |
| Energy and resources | Gas compressor train with emergency shutdown |
| Medical devices | Volumetric infusion pump, hospital fleet |
| Electronics and high tech | Data-centre storage array controller pair |
| Nuclear | Emergency diesel generator train |
Defence and aerospace: aircraft electrical power
Two engine-driven integrated drive generators, an APU generator, a ram air turbine, two generator control units and the contactors that tie the buses together. The safety question is not how often a generator fails, it is what the aeroplane does when the last source is gone.
| Safety quantity | Value |
|---|---|
| Failure condition | Total loss of AC power in flight |
| Severity classification | Catastrophic |
| Probability target | Below 1 × 10⁻⁹ per flight hour |
| Modelled top-event probability | 4.2 × 10⁻¹⁰ per flight hour |
| Structural rule applied | No single failure may produce the condition |
| Design assurance level, GCU logic | DAL A |
| Generation chain, series sum of item rates | 730 per 10⁶ flight hours |
| Exposure | 5-hour flight; 3,000 flight hours per aircraft-year |
The sequence matters more than any of those figures. Consequence came first: total loss of AC power in flight is catastrophic because of what it does to the aircraft, not because of anything the generators are made of. The classification then selected the target of below 1 × 10⁻⁹ per flight hour, before a single λ had been agreed. Quantification arrived last, showing 4.2 × 10⁻¹⁰, a margin of roughly a factor of 2.4. The number is a demonstration, not a decision, and reading the analysis backwards, as though the achieved probability justified the classification, inverts the logic set out in the foundations chapter.
The second point surprises engineers arriving from a reliability background. In civil aviation certification a catastrophic failure condition may not result from a single failure, whatever probability that failure carries. The rule is qualitative and it outranks the arithmetic: an architecture in which one generator control unit could take out both channels is rejected on structure even if its computed contribution were vanishing. That rule belongs to its own sector and does not transfer as written to the railway, automotive or process regimes below, each of which handles single points of failure in its own way. What does transfer is the habit of reading a fault tree for its cut-set orders before reading it for its numbers.
Notice also the distance between the item rates and the answer. The generation chain sums to 730 failures per 10⁶ flight hours, which is 7.3 × 10⁻⁴ per hour, and the failure condition sits at 4.2 × 10⁻¹⁰. The architecture buys about six orders of magnitude and it buys them from independence: different engines, different drives, separate control units, a ram air turbine sharing nothing with the others. The GCU's DAL A assignment covers the part of that argument no rate can reach. Its 90 per 10⁶ flight hours is a random-hardware figure; the systematic failures of its logic are not quantified at all and are answered with development assurance instead.
Railway: level-crossing controller
A crossing has two ways to be wrong and only one of them can kill anybody. The whole design exists to keep the failure rate pointed at the harmless one.
| Safety quantity | Value |
|---|---|
| Hazard | Crossing indicates clear to road while a train approaches |
| Integrity level | SIL 4 |
| Tolerable hazard rate | 1 × 10⁻⁹ per hour |
| Achieved hazard rate | 7 × 10⁻¹⁰ per hour |
| Wrong-side rate before mitigation | 6 per 10⁶ h |
| Wrong-side rate after the vital architecture | 0.7 × 10⁻³ per 10⁶ h |
| All failures, series total | 1,940 per 10⁶ h |
| Fail-safe direction | Barriers down, road signal to danger, train signal to red |
| Barrier-down proving switch, dangerous undetected λ | 0.9 per 10⁶ h |
| Proof test interval, 90 days | 2,160 h, giving λT/2 = 9.7 × 10⁻⁴ |
Follow the wrong-side number through and the achieved hazard rate stops being mysterious. Before mitigation, 6 per 10⁶ hours of the crossing's failures could show clear to road with a train coming. The 2oo2 vital processor and the fail-safe drive arrangement take that to 0.7 × 10⁻³ per 10⁶ hours, a factor of about 8,600, and 0.7 × 10⁻³ per 10⁶ hours is 7 × 10⁻¹⁰ per hour, exactly the achieved hazard rate above. The SIL 4 argument is not a separate calculation bolted on at the end; it is the wrong-side rate, restated in the units the tolerable hazard rate uses.
The price is visible in the other line. Total crossing failure rate is 1,940 per 10⁶ hours and essentially all of it now points the safe way: barriers down, signals to danger, road traffic stopped, trains delayed. Fail-safe is a direction, and the direction is bought with availability, which is why the same crossing appears in the availability column as a story about degraded operating hours. Reducing the 1,940 without attending to which way each failure resolves optimises the wrong quantity and can easily make the 0.7 × 10⁻³ worse.
Even a well-behaved fail-safe design hides a trap, and this one carries it. The barrier-down proving switch has a dangerous undetected rate of 0.9 per 10⁶ hours and is proof tested every 90 days, an average unavailability of λT/2 = 9.7 × 10⁻⁴. That is a protective element dead for an average of half its test interval, and 9.7 × 10⁻⁴ is a large number to leave loose inside an argument targeting 10⁻⁹. It is tolerable only because the switch is a confirmation rather than a barrier, and establishing that distinction is what the cut-set work in the systems chapter is for. Were it wrong, the answer would be a shorter interval, not a better switch.
Space systems: satellite attitude control
Four reaction wheels of which three are needed, two star trackers, three magnetorquers and an onboard computer with a cold spare. Seven years, no repair, and a hazard with no safe state to fall into.
| Safety quantity | Value |
|---|---|
| Hazard | Loss of attitude control |
| Immediate consequence | Loss of mission |
| If deorbit capability is lost with it | Debris and collision-avoidance obligation outliving the mission |
| Design life | 7 years (61,320 h), no repair possible |
| 3-out-of-4 wheel reliability at 7 years | 0.87 |
| Whole AOCS reliability at 7 years | 0.81 |
| Probability of losing attitude control in life (1 − 0.81) | 0.19 |
| Restoration action | Ground reconfiguration, mean 7.2 h, no second attempt |
| Safe state available | None |
Every other row in this chapter has somewhere to fail towards. The crossing drops its barriers, the compressor trips, the brake system falls back to hydraulics, the diesel is itself a fallback. Attitude control has nothing of the kind: an uncontrolled spacecraft does not settle into a benign condition and no maintainer can restore one. When the safe state does not exist, the whole argument has to be carried by prevention, which is why the design answer is four wheels for three, two trackers and a cold-spare processor rather than a protective function.
The consequence line teaches what the other seven cannot. A subsystem reliability of 0.81 over seven years means a 0.19 probability of losing attitude control during the mission, and as a probability of injury that would be indefensible in any regime on this page. It is accepted because the direct consequence is loss of an asset the operator owns. What changes the classification is the second line: if deorbit capability goes with the attitude control, the vehicle becomes a hazard to other operators for as long as it stays up, and the obligation outlives the mission that created it. Severity depends on who is exposed, and a hazard analysis that stopped at "loss of mission" would have missed the only part of this system that is a safety matter at all.
The restoration path deserves a safety reading rather than a maintenance one. Detect from telemetry, diagnose and decide, uplink and confirm: mean 7.2 hours, with no second attempt if the reconfiguration is wrong. That makes the ground segment a protection layer, and a one-shot one. Layers implemented as human procedure are legitimate, but they must be analysed as seriously as hardware, failure modes included, and the maintainability column shows what those 7.2 hours are made of.
Automotive: electric vehicle brake system
Two brake ECUs, an electro-hydraulic actuator, four wheel-speed sensors and an independent backup hydraulic path, in a fleet large enough to turn a rare event into a weekly one somewhere.
| Safety quantity | Value |
|---|---|
| Hazard | Unintended loss of service braking above 50 km/h |
| Severity | S3, life-threatening |
| Exposure | E4, high, every drive |
| Controllability | C3, difficult to control |
| Resulting classification | ASIL D |
| Decomposition | ASIL B(D) primary electronic path plus ASIL B(D) independent backup hydraulic path |
| System λ, series, no redundancy credit | 410 per 10⁶ h |
| Duty and fleet | 500 h per vehicle-year; 200,000 vehicles |
| Backup hydraulic path λ | 20 per 10⁶ h, dormant |
| Backup path exercised at annual service, T = 500 h | λT/2 = 5.0 × 10⁻³ |
This scheme prices three things where the aircraft scheme priced one. Severity S3 says the outcome is life-threatening; exposure E4 says the situation occurs on essentially every trip; controllability C3 says the average driver cannot be relied on to recover. Together they select ASIL D, and moving any one of them moves the answer: the same loss of braking at very low speed, or in a situation drivers rarely meet, lands elsewhere. Exposure and controllability are engineering inputs, not commentary, and arguing a hazard down from C3 to C2 is a legitimate activity that has to be evidenced rather than asserted.
Decomposition is the second lesson and the more dangerous one. An ASIL D requirement met by two paths at ASIL B(D) each is a standard and sound move, but the notation is a promise that no single cause defeats both paths. Here the promise is credible because the backup is hydraulic: different physics, a different energy path, different failure mechanisms, which is the sort of diversity the independence arguments in the systems chapter will accept. Two software channels on one ECU, sharing a supply and a clock, would carry the same notation and none of the substance.
Then the dormancy problem, which decomposition invites and rarely resolves. The backup contributes 20 of the 410 per 10⁶ hours, so a reliability reading dismisses it. Its safety weight is not its rate but the chance it is already dead when the primary path calls: exercised only at annual service, T = 500 hours, that is λT/2 = 5.0 × 10⁻³. Across 200,000 vehicles that is about 1,000 cars driving at any moment with one of their two ASIL B(D) legs missing, while the same fleet arithmetic turns 0.205 failures per vehicle-year into roughly 41,000 events a year. A decomposition is worth what the second path's availability is worth, which is a question for the testability column.
Energy and resources: gas compressor train
A gas turbine driver, a centrifugal compressor, a lube oil system, vibration monitoring, and a 2oo3 emergency shutdown trip with a shutdown valve at the end of it. The safety instrumented function fails its target on a schedule rather than on a fault.
| Safety quantity | Value |
|---|---|
| Safety instrumented function | 2oo3 ESD trip with shutdown valve |
| Target integrity | SIL 2 |
| Shutdown valve λ, total | 40 per 10⁶ h, dormant |
| Shutdown valve, dangerous undetected λ | 12 per 10⁶ h |
| Trip logic solver λ | 30 per 10⁶ h |
| Proof test interval | 12 months, 8,760 h |
| PFD, valve alone | 12 × 10⁻⁶ × 8,760 / 2 = 5.3 × 10⁻² |
| Verdict on that basis | Fails SIL 2 |
| With partial stroke testing every 3 months | Loop PFD 6.4 × 10⁻³, inside the SIL 2 band |
Work the arithmetic and notice what it is sensitive to. Average probability of failure on demand for a dormant item tested at interval T is λ_DU × T / 2, because the item is on average halfway through its exposure window when the demand arrives. At 12 per 10⁶ hours with an annual test that is 5.3 × 10⁻², and the valve alone misses SIL 2 before the sensors, the logic solver or the wiring have been considered. Quarterly partial stroke testing raises effective coverage and brings the loop to 6.4 × 10⁻³, an improvement of about a factor of eight, without changing a single piece of hardware. The integrity level is a property of the loop plus its test regime, never of the valve.
That has a blunt operational consequence. A SIL claim built on a three-month partial stroke interval is void the moment the site stops performing it, and the paperwork will not notice. This is where an engineering assumption becomes an operating requirement, and it has to be written down as one, tracked as one, and fed back through a FRACAS when a test is missed or a stroke fails. The four-year turnaround cycle sharpens the point: the protective function must be proved repeatedly during the run, not at the end of it.
The 2oo3 vibration vote shows the other half of the trade. One sensor failing high will not trip the train, which protects a machine whose unplanned stop is enormously expensive, and the same arrangement is slightly more likely to fail to trip when the machine really is in distress. Spurious trip and fail-to-danger pull in opposite directions, and the consequence of each decides the lean. Note too that the logic solver at 30 per 10⁶ hours is not the constraint; the final element is, as it usually is, and a loop analysis spending its effort on sensors is spending it in the wrong place. Where such rates come from is the subject of reliability prediction.
Medical devices: infusion pump fleet
A pumping mechanism, an occlusion sensor, an air-in-line detector, a dose controller with its user interface, and a battery, six hundred times over. The dominant hazard is delivered mostly by pumps that are working perfectly.
| Safety quantity | Value |
|---|---|
| Dominant hazard | Over-infusion |
| Use-related contribution, programming and setup error | About four fifths |
| Device-failure contribution | The remaining minority |
| Pump λ | 1,460 per 10⁶ h |
| Failures per pump-year at 2,500 h | 3.65 |
| Fleet failures per year, 600 pumps | About 2,190 |
| Safety-critical detection function | Air-in-line detector, λ 120 per 10⁶ h |
| No-fault-found on returned pumps | 17%, mostly setup error reported as device failure |
Take the four-fifths figure seriously and the usual way of working comes apart. A programme that eliminated device failure entirely, driving 1,460 per 10⁶ hours to zero, would leave the majority of the over-infusion hazard exactly where it was. The λ table is a minority report on this device, and a safety case built on it would be quantitatively impeccable and substantially beside the point. The same figure reads differently in the reliability column, where 3.65 failures per pump-year and 2,190 fleet events are genuinely useful for maintenance planning and misleading about harm.
If the hazard arrives through the interface, the interface is where the safety work goes. Usability engineering here is not styling, it is hazard control by design, and it obeys the same order of precedence as any other measure: make the dangerous entry impossible where you can, hard where you cannot, and conspicuous where it must remain possible. Constrain the dose ranges the device will accept; require confirmation where a misplaced decimal point changes an outcome by a factor of ten. These are design measures with the standing of a redundant sensor, and unlike an instruction in a manual they can be tested. The precedence itself is set out in the design chapter.
The feedback loop is where the warning lands. Returned pumps show 17% no-fault-found, mostly setup error reported as device failure, so the organisation's own incident data systematically mislabels its dominant hazard as a hardware problem. Left alone that pushes investment towards components and away from the interface, and it does so while looking like evidence. Correcting the attribution is a safety activity, and it requires the reporting system to record what the user was doing, not only what the device was doing.
Electronics and high tech: storage array controller pair
Two active-active controller boards, dual power supplies, drive shelves, and a lithium backup unit protecting the write cache. The functional analysis and the safety analysis of this array are looking at different objects.
| Safety quantity | Value |
|---|---|
| Hazard | Thermal runaway of the lithium backup unit |
| Hazard character | Stored energy, not loss of function |
| Lithium backup unit | 900 FIT, that is 0.9 per 10⁶ h |
| Controller board | 3,000 FIT, that is 3.0 per 10⁶ h, 2 fitted |
| Single controller unavailability, 4-hour response | q = 1.2 × 10⁻⁵ |
| Controller pair, independent repair | q² ≈ 1.4 × 10⁻¹⁰ |
| Design response | Cell-level protection, enclosure containment, state-of-health monitor |
Everything the availability engineer cares about is the controller pair, and the pair produces 1.4 × 10⁻¹⁰, a number small enough to stop being interesting. That is exactly why the row belongs in a safety chapter. The hazard on this array is not a loss of function at all, it is an energy source: a lithium unit whose failure mode is thermal runaway, sitting in a rack, in a room full of other racks. Losing the array harms a service level agreement. Losing the battery in the wrong direction harms a building.
Energy-source hazards behave differently under every move an engineer instinctively reaches for. Redundancy makes them worse, because a second backup unit doubles the stored energy and therefore the exposure, while improving every availability figure in the table. The design response is layered instead, and the layers map onto the classic precedence: cell-level protection tries to prevent the runaway, enclosure containment accepts that prevention can fail and limits what the failure reaches, and the state-of-health monitor detects the approach in time for someone to act. Three mechanisms, three different assumptions about what has already gone wrong.
One caution about the rate. 900 FIT covers every way the unit can fail, and the overwhelming majority of those ways are benign: it stops holding charge, it reports a fault, it is swapped. The hazardous mode is a fraction of the 900 that this table does not give, and no honest argument may quietly treat a unit rate as a hazard rate. Getting from one to the other is mode-level work, which is what an FMEA exists to produce, and it is the step most often skipped when a component rate is available and a mode split is not.
Nuclear: emergency diesel generator train
A standby machine that sits idle for years, is demanded on loss of offsite power, and is one layer among several. Its unavailability is not a subsystem property; it is an input to a plant-level risk number.
| Safety quantity | Value |
|---|---|
| Hazard | Station blackout |
| Failure to start, per demand | 3.0 × 10⁻³ |
| Failure to run, per hour | 1.0 × 10⁻³ |
| One train over a 24-hour mission | 3.0 × 10⁻³ + 2.37 × 10⁻² = 2.67 × 10⁻² |
| Two trains, treated as independent | 7.1 × 10⁻⁴ |
| Common-cause fraction β | 0.05 |
| Independent part of the pair, (0.95 × 2.67 × 10⁻²)² | 6.4 × 10⁻⁴ |
| Common-cause part, 0.05 × 2.67 × 10⁻² | 1.3 × 10⁻³ |
| Realistic pair value with common cause included | 2.0 × 10⁻³ |
| Monthly 2-hour surveillance starts | 2.7 × 10⁻³ unavailability |
| Allowed outage time, technical specifications | 72 h |
| Latent contribution, λ_DU 45 per 10⁶ h, T = 730 h | λT/2 = 1.6 × 10⁻² |
Defence in depth changes what the numbers are for. Nobody claims the diesel train makes the plant safe; the claim is that it is one layer and that the layers together hold. Its unavailability therefore enters the probabilistic risk assessment as a direct contributor to core damage frequency, alongside layers with nothing to do with electrical power. This is the only row where the safety target does not belong to the system being analysed, and that disciplines the engineer: improving the diesel is worth precisely what it moves the plant number, and no more.
Common cause decides what the second train is worth. Two trains multiplied as independent give 7.1 × 10⁻⁴ over the mission; split the single-train figure with a common-cause fraction of β = 0.05 and the pair separates into an independent part of 6.4 × 10⁻⁴ and a common-cause part of 1.3 × 10⁻³, a realistic pair value of about 2.0 × 10⁻³ in which the common-cause contribution is roughly twice the independent one and the honest answer is three times worse than multiplication promised. The engineering reading is unambiguous even where the arithmetic is delicate: once a shared cause is admitted, adding identical hardware stops buying what multiplication promises. Difference buys more. Diverse fuel supplies, staggered maintenance so one crew never touches both trains on the same day, physical separation and different procedures attack β itself, which is the only term a third identical diesel would leave untouched.
The surveillance regime closes the loop and contains a real paradox. Between tests the train accumulates dangerous undetected failures at 45 per 10⁶ hours, and the monthly interval of 730 hours gives λT/2 = 1.6 × 10⁻², much the largest single term here. The monthly start is what stops that growing without limit. Yet each 2-hour surveillance start makes the train unavailable while it runs, contributing 2.7 × 10⁻³ of unavailability in its own right, and the technical specifications cap corrective work at 72 hours precisely because a layer removed for maintenance is a layer that is not there. Testing a standby safety function consumes the thing it measures, and choosing the interval balances the two effects, seen from the other side in the testability column.
What the eight rows have in common
Read down the column and one shape repeats in all eight. The target came from the consequence rather than from what the hardware could plausibly achieve, the architecture was settled on qualitative grounds before quantification began, and the computed probability arrived last to confirm a decision already taken. The aircraft's answer came from a consequence classification and a structural rule that outranks arithmetic; the crossing's from failure direction, paid for in delay; the satellite's from a hazard with no safe state and a duty owed to third parties; the vehicle's from an exposure-and-controllability judgment and a decomposition worth only its independence; the compressor's from a test interval that decides an integrity level without touching hardware; the pump's from a hazard that arrives through the interface; the array's from an energy source that redundancy makes worse; and the diesel's from common cause and from being one layer among several.
Two habits fall out of the set. The first is that the analysis boundary must include whatever actually delivers the harm, which meant the operator on the pump, the ground segment on the satellite, the proof-test regime on the compressor and the surveillance schedule on the diesel. The second is that a rule belonging to one sector must not be carried across the boundary as though it were physics. The single-failure prohibition, the ASIL decomposition notation, the SIL bands and the technical specifications each come from a regime with its own history and its own residual assumptions, and borrowing one into another sector is among the commonest ways a safety argument quietly stops being true. The ladders are laid side by side in the foundations chapter.
That is also the argument for reading the other four columns. Safety consumed reliability data in every row above and took those rates on trust from reliability; its proof-test and repair intervals are set in maintainability; the cost of failing in the safe direction is counted in availability; and whether a dangerous failure is revealed at all, which decided the crossing's proving switch, the vehicle's backup path, the compressor's valve and the diesel's latent term, is settled in testability.