RAMSynapse
Log inSign up

Testability · Chapter 6

End-to-End Industry Examples

One worked system per industry, carried through all five RAMS properties.

A coverage percentage is the easiest number in RAMS to quote and the hardest to earn. This chapter takes eight systems, one from each industry the platform serves, and works the testability question on each: what announces itself, what stays silent, how long the silence lasts, how precisely the announcement names its culprit, and how often the test speaks when nothing is wrong. The arithmetic is the rate-weighted bookkeeping of the foundations chapter; what changes from row to row is which test access the physics permits, and what the design had to invent when the obvious test was impossible.

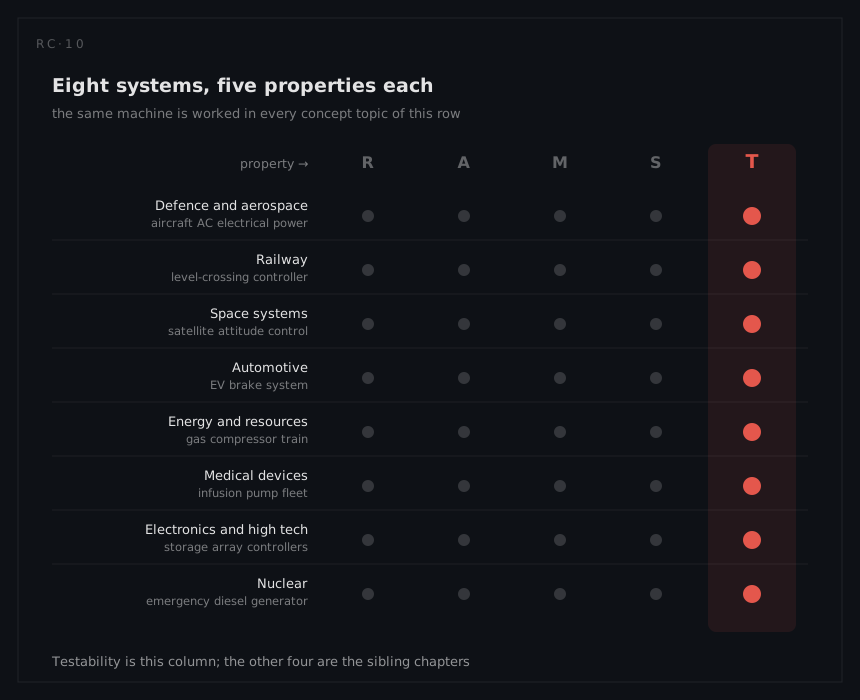
The eight systems are the same in every concept topic of this row. The aircraft electrical system worked here for its built-in test coverage is the one worked in reliability for its failure rates, in maintainability for its repair times, in availability for its dispatch and in safety for its catastrophic failure condition. Read a column and you learn one property across eight industries; read a row and you watch one machine reveal its five RAMS faces. All numbers are illustrative, invented for teaching and chosen to make the arithmetic legible; none is field data from any real product.

IndustryThe example system
Defence and aerospaceTransport aircraft AC electrical power generation and distribution
RailwayWayside level-crossing controller
Space systemsEarth-observation satellite attitude control
AutomotiveElectric vehicle brake system with regenerative blending
Energy and resourcesGas compressor train with emergency shutdown
Medical devicesVolumetric infusion pump, hospital fleet
Electronics and high techData-centre storage array controller pair
NuclearEmergency diesel generator train
The matrix this chapter is one column of. Eight systems, one per industry, each carried through all five properties: read down for one property across eight industries, read across for one machine's five RAMS faces.

Defence and aerospace: aircraft electrical power

Two generation channels watched continuously by DAL A control units, plus one source that spends its entire service life folded into the fuselage doing nothing. Those two populations need completely different test provisions, and the headline coverage figure only describes the first of them.

MeasureValue
System failure rate730 per 10⁶ flight hours
GCU built-in test detection coverage92% of failure rate
Undetected fraction (derived: 8% of 730)58.4 per 10⁶ FH
Fault isolation to one LRU88% of occasions
Ram air turbine λ40 per 10⁶ FH, dormant
RAT functional check interval500 flight hours
RAT latent unavailability, λT/21.0 × 10⁻²

The 92% is failure-rate-weighted, and insisting on that is the first discipline of the row. Counted by mode, a generation system flatters itself easily, because the long tail of rare mechanical mechanisms inflates the denominator with items the fleet will hardly ever see. Weighted by rate, the number predicts something checkable: at 3,000 flight hours per aircraft-year the system produces about 2.19 failures per aircraft-year, of which roughly 0.175 arrive with nothing said. That is the population the maintenance organisation meets as a crew report rather than a fault code, and it is the population against which the coverage claim will eventually be audited.

The ram air turbine is the whole testability problem in one line item. Built-in test cannot see it, not because the monitors are poor but because a dormant machine has no operating signature to monitor: there is no current to sense, no temperature to trend, no bus to interrogate. Its only test is the 500-flight-hour functional check, and the exposure between checks converts a rate into a probability of being already broken when demanded: 40 × 10⁻⁶ × 500 / 2 gives 1.0 × 10⁻², so roughly one deployment in a hundred meets a turbine that failed at some unknown earlier moment. That figure does not appear in any reliability table; it enters the fault tree behind the catastrophic loss-of-all-AC-power condition as a plain probability, sitting alongside the events that create the demand. Halve the check interval and you halve it, which is the cheapest lever the design still owns after the hardware is frozen.

Isolation earns its own attention. Detecting 92% and isolating 88% of those detections to a single line-replaceable unit leaves an ambiguity residue priced in whole units, not minutes: whenever the symptom implicates two boxes, one healthy box travels. Against the 26-hour outstation logistics delay in the availability column, a wrong removal does not merely waste a unit, it consumes the spare the next aircraft needed. The dispatch relief allowing flight with one generator inoperative for three days depends entirely on the diagnosis being right about which generator; a relief clause is usable only to the extent the test system can be trusted.

Railway: level-crossing controller

A crossing has the lowest detection coverage in this chapter and the highest value per coverage point, because reaching the equipment at all requires a night possession of the railway.

MeasureValue
Crossing failure rate1,940 per 10⁶ h
Remote condition monitoring coverage78% of failure rate
Undetected fraction (derived: 22% of 1,940)426.8 per 10⁶ h
Barrier-down proving switch, undetected dangerous λ0.9 per 10⁶ h
Proof-test interval90 days (2,160 h)
Latent contribution, λT/29.7 × 10⁻⁴

Remote condition monitoring is doing something different here from built-in test on an aircraft. It does not shorten a repair; the maintainability column shows active repair at 2.5 hours inside a mean down time of 9.5 hours, and the gap is access, not diagnosis. What the monitoring buys is the dispatch decision: knowing before the possession is booked whether the fault is a lamp unit, an axle counter or a barrier drive decides whether the technician clears the job in one night or discovers the truth at 02:00 and returns in a fortnight. Detection coverage converts into possessions avoided, which is why 78% is worth investing in even though it looks unimpressive beside a satellite's 96%.

The proving switch shows the limit of rate-weighted thinking. Its undetected dangerous rate of 0.9 per 10⁶ hours is less than a twentieth of one per cent of the crossing's total failure rate: a budget allocated purely by λ would ignore it and be correct by its own logic, yet the SIL 4 argument in the safety column collapses without it. This is the practical meaning of weighting the coverage budget by consequence as well as by rate. Detection floors belong on the modes that feed protective functions regardless of how rarely they occur, because their cost is measured in probability of failure on demand rather than in maintenance hours.

The interval is the free variable, and the linearity of λT/2 makes the trade clean. At 90 days the latent term is 0.9 × 10⁻⁶ × 2,160 / 2 = 9.7 × 10⁻⁴. Move to a 30-day cycle and the same arithmetic gives 0.9 × 10⁻⁶ × 720 / 2 = 3.2 × 10⁻⁴, a threefold improvement bought with scheduling rather than hardware. Whether that is worth doing depends on what each visit costs and whether the visit itself introduces failure, which is exactly the calculation the nuclear row makes explicit.

Space systems: satellite attitude control

Telemetry is not the best test access on this system. It is the only test access that will ever exist, and every testability decision follows from that single fact.

MeasureValue
Telemetry detection coverage96% of failure rate
Housekeeping share of the downlink budget4% of total
Cold-spare processor dormant rate (10% of 2)0.2 per 10⁶ h
Median detection from telemetry40 min
Diagnose and decide4 h
Uplink and confirm2.5 h
Mean restoration7.2 h

There is no shop, no removal, no external test equipment and no second look. A failure mode that produces no telemetry signature is not merely undetected in the sense the other seven rows use the word: it is permanently undiagnosable, for seven years, with no recovery path of any kind. That is why the coverage target is set at 96% before the design starts rather than measured afterwards, and why the constraint on it is unusual. Housekeeping telemetry gets 4% of the downlink, competing for bandwidth with the imagery the mission exists to collect. This is the only row where testability is priced in bits per second, and the design conversation is a genuine trade: one more monitored parameter is one less line of payload data, forever.

Detection latency is visible here in a way it is nowhere else. The 40-minute median time to notice is a declared line inside the 7.2-hour restoration, about 9% of it, sitting ahead of four hours of diagnosis and two and a half of uplink. In most systems that latency hides inside a repair time nobody decomposes; on a spacecraft it is budgeted and optimised deliberately, because the safe-mode entries in the availability column cost imaging time from the moment the fault occurs, not from the moment somebody sees it.

The cold spare poses the dormancy dilemma with no good answer available. At 10% of the active rate it accrues 0.2 per 10⁶ hours while sitting idle, and telemetry from an unpowered processor says almost nothing about whether it will boot. The only real test is to switch to it, and switching costs a control discontinuity on a spacecraft whose purpose is pointing stability. Every other system here resolves that tension with a periodic exercise; on this one the exercise is itself the event you are trying to avoid, so the design accepts a known blind spot and writes the recovery procedure assuming the spare might not answer.

Automotive: electric vehicle brake system

A product with no maintainer, no test equipment on board and two hundred thousand copies in service, which forces the diagnosis to be automatic, continuous and cheap.

MeasureValue
System failure rate410 per 10⁶ h
On-board diagnostics coverage94% of failure rate
Undetected fraction (derived: 6% of 410)24.6 per 10⁶ h
Isolation to one replaceable unit82% of occasions
Backup hydraulic path λ20 per 10⁶ h, dormant
Exercise interval (annual service)T = 500 h
Latent contribution, λT/25.0 × 10⁻³
Dealer no-fault-found on returned brake ECUs21%

The power-up self test is what makes 94% achievable at all. A vehicle performs several hundred start-up cycles a year, so the readiness check runs constantly by accident of use and every drive begins with a fresh verdict on the paths the test can reach. Set that beside the crossing, where nothing initiates a test unless a person schedules one, and the coverage gap stops being a statement about the sophistication of the electronics and becomes a statement about duty cycle.

The backup hydraulic path is where testability meets the ASIL D decomposition in the safety column. That argument splits the requirement into two ASIL B(D) legs, one electronic and one hydraulic, and its whole force rests on the second leg being there when the first fails. A dormant leg exercised only at the annual service carries 20 × 10⁻⁶ × 500 / 2 = 5.0 × 10⁻³ of latent unavailability, so roughly one drive in two hundred begins with an independent leg that may already be gone, and neither the driver nor the vehicle can know. The service interval is therefore a safety parameter, not a convenience of the ownership schedule, and it belongs in the safety case with the same standing as the redundancy it protects.

The no-fault-found figure is the isolation shortfall wearing the supply chain's uniform. Isolation to one unit succeeds 82% of the time and 21% of returned brake ECUs test good: one phenomenon measured at two ends of the same pipeline. Fleet scale makes it concrete. Two ECUs at 60 per 10⁶ hours give 120 per 10⁶ hours; at 500 operating hours across 200,000 vehicles that is 12,000 genuine ECU failures a year. If those are the 79% that are real, the returned stream is about 15,200 units, so roughly 3,200 healthy ECUs are packed, shipped, tested and entered into the failure records as data that is simply untrue. Tracking that rate through FRACAS is the only way a programme learns whether a threshold change made things better or merely quieter.

Energy and resources: gas compressor train

One machine carrying two entirely separate test regimes: continuous condition monitoring that protects production, and periodic proof testing that protects people. They share no equipment, no interval, no budget and no owner.

MeasureValue
Production-affecting failure rate1,180 per 10⁶ h
Vibration and lube monitoring coverage88% of that rate
Undetected fraction (derived: 12% of 1,180)141.6 per 10⁶ h
ESD shutdown valve λ40 per 10⁶ h, dormant
of which dangerous undetected12 per 10⁶ h
Proof-test interval12 months (8,760 h)
Valve PFD on proof testing alone5.3 × 10⁻²
Loop PFD with 3-monthly partial stroke6.4 × 10⁻³

On the production side, 88% coverage does something the other rows mostly do not: it changes the category of the work rather than its speed. A hot section whose degradation is trended is repaired in a planned window; the same hot section discovered by failure imposes the 340-hour unplanned outage in the maintainability column. Coverage here is the mechanism by which reliability-centred maintenance converts calendar-based intervention into condition-based intervention, and the 12% that monitoring misses is precisely the population that turns up as an unwelcome discovery at turnaround.

The shutdown valve's dangerous undetected fraction is the entire safety problem. Of its 40 per 10⁶ hours, 12 are dangerous and silent: 30% of the item's failure rate sits in the one category that neither reveals itself nor fails to the safe side. Proof tested annually, the valve alone gives a probability of failure on demand of 12 × 10⁻⁶ × 8,760 / 2 = 5.3 × 10⁻², which fails SIL 2 without help from anything else in the loop. The obvious remedy, testing more often, is unavailable: fully stroking a shutdown valve stops the train, and a quarterly production outage is not a price anyone will pay for a test. So the industry invented a test that fits the constraint. Partial stroke testing moves the valve a fraction of its travel every three months, exercising the sticking and seizure mechanisms that dominate the dangerous undetected population without interrupting flow, and the loop lands at 6.4 × 10⁻³, roughly a factor of eight better and inside the SIL 2 band. Partial stroke testing is what a coverage problem looks like when it is solved by inventing a new test rather than by shortening an interval, and the move it embodies, finding a partial exercise that reaches the dominant modes, generalises far beyond valves.

A third test structure hides in the instrument set. The 2oo3 vibration arrangement exists for voting, but voting is also diagnosis: three sensors that should agree provide continuous cross-comparison, so a channel drifting away from its peers is detected by its peers with no dedicated monitor at all. Redundancy used as a diagnostic mechanism is among the cheapest coverage available, wherever a design already carries parallel channels for other reasons.

Medical devices: infusion pump fleet

The self test on this device is not a maintenance signal. It is a permission, and the person reading it is a clinician at three in the morning who has one patient waiting and no interest in diagnostics.

MeasureValue
Pump failure rate1,460 per 10⁶ h
Power-on self test coverage91% of failure rate
Undetected fraction (derived: 9% of 1,460)131.4 per 10⁶ h
Fleet failures a year (600 pumps at 2,500 h)about 2,190
Undetected share of those (derived: 9%)about 197 a year
No-fault-found on returned pumps17%

Designing a release-to-use gate imposes constraints a maintenance test never faces. It must finish in the seconds a nurse will actually wait, or it will be worked around. Its verdict must be binary and legible without training, because there is no engineer in the room. And its bias must be chosen deliberately, since a gate that passes a sick pump puts a device on a patient while a gate that fails a healthy one removes capacity the ward needs. The 9% the test does not cover, roughly 197 fleet events a year, is the population that begins a therapy on a pump nobody knows is degraded: a materially different exposure from the same percentage on an aircraft with a crew and a maintenance organisation watching.

The air-in-line detector deserves separate treatment because it is itself a protective device. Its failure is dangerous and silent unless something checks the checker, so the self-check on that channel is not one line item among five, it is the mechanism that stops a safety function from failing quietly. The rule that monitors carry their own failure modes and belong in the FMEA like everybody else's is nowhere more literal, because a dead air detector silences precisely the alarm the hazard analysis relies on.

The 17% no-fault-found rate tells a story the other rows do not. Most of it is setup error reported as device failure: the pump was working, the programming was wrong, and the device is returned because that is what a ward does with equipment it has lost confidence in. The test is right and the report is wrong, a category of no-fault-found that no threshold change will fix. The safety column finds about four fifths of the over-infusion hazard use-related, so the diagnostics are being asked, informally, to diagnose the human-device system and they have no instrument for it. The arithmetic still bites: if the 2,190 genuine failures are the 83%, the bench sees about 2,640 units a year, and roughly 450 healthy pumps make the trip and occupy loaner-pool capacity the availability column shows the fleet cannot spare.

Electronics and high tech: storage array controller pair

Two test worlds, both designed in from the start, and an availability budget so small that the time to notice a failure matters more than the time to fix it.

MeasureValue
Controller board3,000 FIT (3.0 per 10⁶ h), 2 fitted
Power supply1,500 FIT, 2 fitted
Drive0.4% annualised failure rate
Lithium backup unit900 FIT
Manufacturing test accessboundary scan
In-service coverage (telemetry and drive self-monitoring)97% of failure rate
Undetected controller rate (derived: 3% of 3.0)0.09 per 10⁶ h
Returned-unit no-fault-found24%
Single-controller unavailability, 4-hour response1.2 × 10⁻⁵
Availability budget0.99999, 5.3 minutes a year

Boundary scan in manufacture is the reason in-service coverage can be about ageing rather than workmanship. A structural test path shifted through every compliant device catches the opens, shorts and misplaced parts that would otherwise leave the factory and be diagnosed expensively in a customer's data centre. What telemetry then has to watch is a population of things that wore out or drifted: a smaller, more tractable inventory of modes, and one reason 97% is reachable.

Because everything is hot-swappable, active repair does not enter the availability arithmetic at all; detection and dispatch do, which inverts the usual priority. The single-controller unavailability of 1.2 × 10⁻⁵ assumes a four-hour on-site response, but the four-hour clock starts when the telemetry speaks, not when the board fails. Every minute of detection latency is a minute the pair spends as a single string with nobody aware of it, and against a budget of 5.3 minutes a year a monitor that takes an hour to notice has spent more than eleven years of the annual allowance in one event. The 3% of the controller rate telemetry misses, 0.09 per 10⁶ hours, is worse, because a silent fault in one board turns the q² promise in the reliability column back into a single controller while the dashboard shows green.

Pairing 97% coverage with 24% no-fault-found is the sharpest lesson this row offers: detection and precision are independent axes. The system announces nearly everything and still convicts an innocent board a quarter of the time, and those returns are the dominant warranty cost. Part of the cause is structural, in the shared backplane and shared firmware that make symptoms ambiguous across the pair, and part is behavioural. The cheaper a replacement is, the more the diagnosis has to be right, because nothing else stops the swapping: when a hot swap costs no downtime, the fastest route to a closed ticket is to change the board, and the field will take it unless the diagnosis is precise enough to make it unnecessary. The lithium backup unit earns a closing note as the third answer to the dormancy question this chapter keeps asking: not a proof test, not a partial stroke, but a continuous state-of-health monitor on a protective item demanded only on power loss.

Nuclear: emergency diesel generator train

There is no built-in test that will tell you whether a standby diesel will start. The only way to know is to start it, which makes the surveillance programme the entire testability provision and turns the test interval into the central design question.

MeasureValue
Undetected dangerous λ between tests45 per 10⁶ h
Surveillance interval, T730 h (monthly)
Latent contribution, λT/21.6 × 10⁻²
Test outage per surveillance start2 h
Test-induced unavailability (2 / 730)2.7 × 10⁻³
Failure to start3.0 × 10⁻³ per demand
Failure to run1.0 × 10⁻³ per hour
Allowed outage time for corrective work72 h

The monthly start converts an entirely latent population into a periodically revealed one, and that sentence is the whole argument for surveillance testing anywhere. Without it, 45 per 10⁶ hours of dangerous undetected failure would accumulate for years until a loss of offsite power discovered it on everyone's behalf. With it the exposure is bounded at λT/2 = 1.6 × 10⁻², and the risk assessment has a defensible input to core damage frequency instead of an assumption.

What makes this row instructive is that the test is not free, and its two costs move in opposite directions. Shortening the interval cuts the latent term linearly, since λT/2 falls with T. It also raises test-induced unavailability, because each surveillance start takes the train out of service for two hours: at monthly intervals that is 2 / 730 = 2.7 × 10⁻³, and the two contributions together give about 1.9 × 10⁻². A term falling with T plus a term rising as 1/T has a minimum where the two are equal, at T = √(2 × 2 / (45 × 10⁻⁶)) ≈ 298 hours, where each is 6.7 × 10⁻³ and the total is 1.34 × 10⁻². Practice does not chase that optimum, for reasons a purely mathematical treatment leaves out: the surveillance start wears the machine, the interval is fixed by the technical specifications, and the dose accumulated by the crew running the test is a first-class cost. The testability question in a standby system is rarely "can we detect it" and almost always "how often can we afford to look."

One asymmetry deserves naming. The surveillance programme is not only the mitigation, it is the measurement instrument: the 3.0 × 10⁻³ failure-to-start probability the whole risk model rests on comes from counting surveillance starts, so the test both reduces the risk and produces the evidence for how much remains. Discovering a fault also has an operational price, because the 72-hour allowed outage time begins when the fault is found, not when it occurred. That creates a quiet pressure not to look too closely, a bias every testing programme carries somewhere and which good practice names openly rather than pretends away.

What the eight rows have in common

Read down the column and four questions turn out to be doing the work in every system, whatever the industry called them. First, what share of the failure rate, not of the mode count, does the test system see: 92%, 78%, 96%, 94%, 88%, 91%, 97%, and in the nuclear case nothing at all until somebody presses start. Second, what sits in the complement, because the undetected fraction is the design agenda and a different Pareto from both the failure-rate list and the downtime list. Third, how long the silence lasts, because a dormant item's λT/2 turns a small rate into a probability that matters: 1.0 × 10⁻² for the ram air turbine, 9.7 × 10⁻⁴ for the proving switch, 5.0 × 10⁻³ for the backup hydraulic path, 5.3 × 10⁻² for an unaided shutdown valve, 1.6 × 10⁻² for the diesel. Fourth, whether the announcement can be believed, which the field grades as no-fault-found: 21%, 17% and 24% in the three rows that send units back to somebody.

Each row adds something the others cannot. The aircraft shows coverage saying nothing about the dormant items outside its scope. The crossing shows consequence, not rate, setting the detection floors. The satellite shows testability bounded by bandwidth and made permanent by the absence of a second look. The vehicle shows a service interval doing safety work at fleet scale. The compressor shows a new test invented because the obvious one was forbidden. The pump shows a self test acting as a release-to-use gate and being asked to diagnose the user. The array shows high coverage and poor precision coexisting comfortably, and cheap replacement making precision matter more rather than less. The diesel shows the test interval as an optimisation with costs on both sides.

That is the argument for reading the other four columns, and for treating the dependency model as the artefact that connects them. Detection coverage is an input to the latent-unavailability arithmetic in availability, to the ambiguity and removal economics in maintainability, to the probability of failure on demand in safety, and to the redundancy assumptions in reliability. A coverage number that is defensible in isolation is still the wrong number to have improved if nobody checked which ledger the undetected fraction was quietly filling.


Want to see this on a live system model? Request a walkthrough.