RAMSynapse
Log inSign up

Maintainability · Chapter 6

End-to-End Industry Examples

One worked system per industry, carried through all five RAMS properties.

Maintainability is the property that only shows itself after something has already gone wrong, which makes it the easiest of the five to specify carelessly and the hardest to recover once the hardware exists. This chapter takes eight systems, one from each industry the platform serves, and works the maintainability question on each of them: when the thing fails, what has to happen before it works again, how long each part of that takes, who is permitted to do it, and where the clock actually goes.

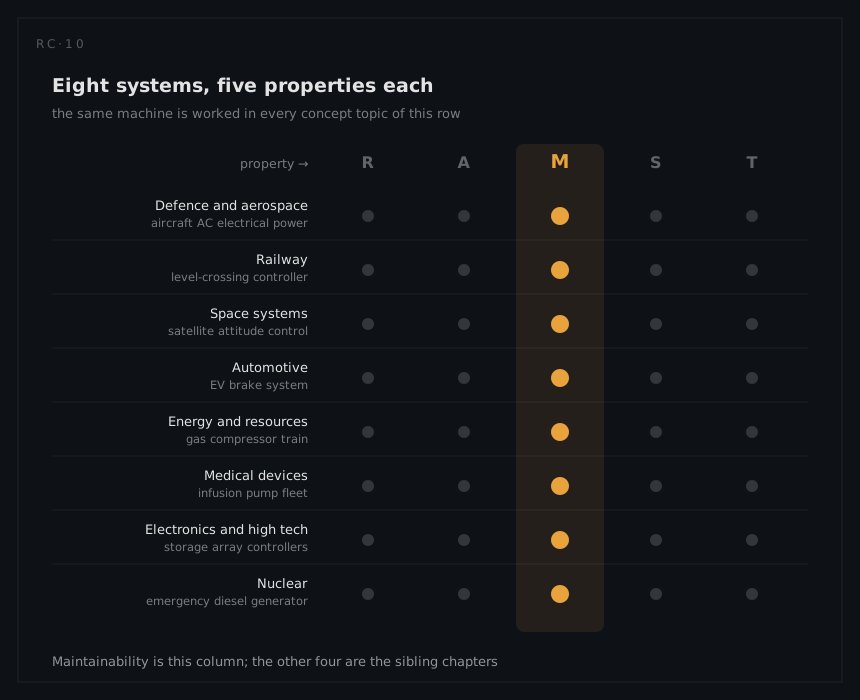
The eight systems are the same in every concept topic of this row. The aircraft electrical system worked here for its repair times is the one worked in reliability for its failure rates, in availability for its dispatch, in safety for its catastrophic failure condition and in testability for its built-in test coverage. Read a column and you learn one property across eight industries; read a row and you watch one machine reveal its five RAMS faces. All numbers are illustrative, invented for teaching and chosen to make the arithmetic legible; none is field data from any real product.

IndustryThe example system
Defence and aerospaceTransport aircraft AC electrical power generation and distribution
RailwayWayside level-crossing controller
Space systemsEarth-observation satellite attitude control
AutomotiveElectric vehicle brake system with regenerative blending
Energy and resourcesGas compressor train with emergency shutdown
Medical devicesVolumetric infusion pump, hospital fleet
Electronics and high techData-centre storage array controller pair
NuclearEmergency diesel generator train
The matrix this chapter is one column of. Eight systems, one per industry, each carried through all five properties: read down for one property across eight industries, read across for one machine's five RAMS faces.

Defence and aerospace: aircraft electrical power

The integrated drive generators, the generator control units and the bus tie contactors are all line-replaceable, a partitioning decision taken years before anyone ever removed one. That decision is what the repair times below are measuring.

Itemλ per 10⁶ FH, all fittedActive repair (h)λ × RShare of expected repair hours
Integrated drive generator500 (2 × 250)1.575073%
Generator control unit180 (2 × 90)0.610811%
Bus tie contactor75 (3 × 25)2.216516%
Roll-up755MTTR = 1,023 / 755 = 1.35 h1,023100%

That roll-up is the failure-rate-weighted average doing its job, and it immediately overturns the obvious reading of the repair column. The contactor has the worst raw time at 2.2 hours, nearly four times the GCU's, yet halving it removes only 82 of the 1,023 weighted hours, an 8% improvement in system MTTR. Halving the IDG's 1.5 hours removes 375, or 37%, because the IDG fails often enough to dominate the event population even with a middling repair time. Note also that the roll-up counts all three contactors, while the reliability column's 730 per 10⁶ chain sum counts the two in the generation path: the maintenance population and the mission-reliability population are not the same list, and quietly reusing one for the other is a common way to get a maintainability prediction wrong.

Two supporting numbers set the boundaries of that 1.35 hours. Fault isolation resolves to a single LRU 88% of the time, which means roughly one removal in eight begins without knowing which box is at fault, and the ambiguity arithmetic then multiplies the interchange and checkout elements for that branch. And MMH/OH of 0.09 is a labour ledger rather than an elapsed one: at 3,000 flight hours per aircraft-year it amounts to 270 maintenance man-hours a year on this system alone, a number that pays for technicians whatever the wall clock says.

The elapsed clock, meanwhile, is decided somewhere else entirely. Inherent availability sits at 0.9991 and operational availability at 0.9962, and the gap is a 26-hour logistics delay on outstation IDG removals, because the spare is held only at the main base. Total downtime for that event is 27.5 hours, of which the celebrated 1.5-hour removal is 5%. The design's real maintainability achievement is not the fast removal but the permission to defer it: dispatch with one IDG inoperative for up to three days lets the aircraft fly home to the spare, converting a 26-hour logistics wait into no downtime at all. Redundancy bought that relief, and the level-of-repair decision that put the spare at one base only is what made it necessary.

Railway: level-crossing controller

A crossing is repaired quickly and stays broken for a long time, and no amount of design attention to the repair itself changes that.

QuantityValue
Active repair time2.5 h
Mean downtime9.5 h
Waiting for the night possession7.0 h
Active repair as a share of downtime26%
Operational availability, 40-crossing fleet0.99818, about 638 crossing-hours a year

Seven of those 9.5 hours are spent waiting for access, because the track cannot be occupied while trains are running and the technician attends during a night possession. Halve the active repair through better modularity, better tooling and sharper diagnostics, and the downtime falls from 9.5 hours to 8.25, an improvement of 13% for what would be a substantial redesign of the wayside cabinet. Every hour bought on the access side is worth the same as an hour bought on the wrench side, and the access side has seven of them lying about untouched. This is the MTTR-versus-MDT trap in its purest form: the design property and the operational property have almost nothing to do with each other here.

Once that is accepted, the engineering moves. If access is the scarce resource, the objective becomes work per possession rather than minutes per repair. The barrier drive units contribute 600 per 10⁶ hours and the lamp units 800, so 1,400 of the crossing's 1,940 total sits in items with predictable mechanical and consumable wear. Both are candidates for block replacement on a planned possession, where the marginal cost of the second job is the labour only, the access having already been paid for. That is a straight RCM argument: the consequence class is operational delay, the failure modes have an age-related character, and the applicable task is scheduled restoration timed to a window that exists anyway.

Remote condition monitoring, detecting 78% of the failure rate, earns its keep in the same currency. Its value is not that it makes the repair faster, because it does not, but that it puts the job on the possession plan before the possession is booked. Turning an unplanned attendance into a planned one is worth the full 7-hour access delay, which no diagnostic improvement applied at the roadside could ever return.

Space systems: satellite attitude control

There is no wrench. Nobody will ever open this machine, and its maintainability programme has to mean something anyway.

Restoration stageTimeShare
Detect the anomaly from telemetry (median)40 min9%
Diagnose and decide4 h56%
Uplink and confirm the new wheel assignment2.5 h35%
Mean restoration7.2 h100%
Second attempt availablenone

The elemental decomposition from the foundations chapter still applies, but every term that a hangar or a workshop would recognise is zero. Preparation, disassembly, interchange, reassembly: none of them exist. What remains is localization, isolation and decision, and they take 4 hours and 40 minutes of the 7.2, with the action itself accounting for the other 2.5. This is the extreme case of a trend visible everywhere in electronics-dense systems, where diagnosis rather than exchange sets the repair time, and it makes the maintainability levers unrecognisable: no captive fasteners or access panels, but procedures, rehearsal on a ground model, decision authority and the quality of the telemetry set.

The absence of a second attempt changes the shape of the requirement more than the absence of a wrench does. A mean of 7.2 hours and a 90th-percentile commitment are both the wrong instruments for a single irreversible action; what matters is the probability that the uplinked reconfiguration is the correct one, which is a correctness requirement rather than a duration requirement. Programmes respond by spending the 4 diagnostic hours deliberately, with independent review before commitment, and by refusing to compress them. Where restoration cannot be retried, slower is frequently the right maintainability answer, which is the opposite of the instinct every other row in this chapter rewards.

One further trap deserves naming: restored to what. The 7.2 hours restores attitude control, not the mission. A safe-mode entry costs 18 hours before imaging resumes and there are 2.5 of them a year, so the operator's downtime clock runs more than twice as long as the engineer's. Defining the end state of the repair is a maintainability decision, and the two definitions here differ by a factor of 2.5. The spares position, meanwhile, was settled at build: the fourth reaction wheel is the spare, carried on board because there is no other pipeline, and the level-of-repair analysis behind that had exactly one chance to be right.

Automotive: electric vehicle brake system

Repairs happen at dealers, driven by diagnostic trouble codes, at a scale that turns a modest repair time into an industrial capacity problem.

QuantityValue
Active repair1.2 h
Fault isolation to one replaceable unit82%
Vehicle off road per incident1.4 days (33.6 h)
of which parts logistics0.9 days (21.6 h)
Active repair as a share of vehicle-off-road time3.6%
No-fault-found on returned brake ECUs21%

Start with the fleet arithmetic, because it reframes everything. The system runs at 410 per 10⁶ hours and 500 operating hours per vehicle-year, so 0.205 failures per vehicle-year; across 200,000 vehicles that is 41,000 events a year, and at 1.2 hours each, roughly 49,200 technician-hours of active work annually before any ambiguity penalty is added. Maintainability at this scale is a network capacity plan, and a fifteen-minute change in the repair time is worth thousands of technician-hours, which is why automotive service engineering fights over connector counts and bolt access in a way that a single-machine programme never would.

The isolation figure and the no-fault-found figure are the same phenomenon observed from opposite ends of the parts pipeline. Eighteen per cent of failures do not resolve to one unit, so the technician swaps on suspicion, and 21% of returned brake ECUs turn out to be healthy. Each of those returns consumed a part drawn from a 21.6-hour logistics pipeline, occupied a service bay, and put a good unit back on a shelf weeks later after test. The lever with the most leverage here is diagnostic resolution, not wrench time, because resolution is the only input that improves elapsed time, parts consumption and warranty cost simultaneously. The testability analysis that sets the isolation claim is therefore a maintainability document in everything but name.

The remainder of the vehicle-off-road clock repays a moment's attention. Of 33.6 hours, 21.6 is parts logistics and 1.2 is the repair; the residual 10.8 hours is booking, queueing, diagnosis and handover. Two thirds of the customer's lost time is the supply chain and almost a third is administration, which means an improvement programme aimed exclusively at the design would be competing for 3.6% of the outcome. Both ledgers are real and both are worth money, but they are owned by different departments and fixed with different budgets.

Energy and resources: gas compressor train

This train contains two named unplanned repairs whose durations differ by a factor of nearly sixty, and that spread is the whole lesson.

Unplanned actionλ per 10⁶ hActive repair (h)λ × RShare
Lube oil system (2 pumps fitted)1,00066,0005%
Turbine hot section350340119,00095%
Partial roll-up1,350weighted mean 92.6 h125,000100%

A weighted mean repair time of 92.6 hours is arithmetically correct and operationally meaningless, because no repair on this train takes anything close to 92.6 hours. It is a statistic describing a bimodal population, and quoting it in a specification would commit the programme to a number that no single job will ever produce. When a repair-time population splits this hard, the honest reporting is two numbers and their frequencies, not one average of them.

The hot section's 340 hours is 14.2 days of work, which no operating window can absorb and which the 21-day turnaround every four years can. So the maintainability question stops being how long and becomes when: can this job be placed inside a window that has already been paid for? The planned turnaround loss is 1.44%, which is why inherent availability of 0.9926 becomes an operational production availability of 0.978. Planned maintenance is not free maintenance; it is pre-paid maintenance, and its price is visible in that 1.44%. The mechanism that makes the placement possible is condition monitoring, detecting 88% of production-affecting failure rate, working on a hot section whose Weibull shape of 3.1 gives it a rising, observable degradation to watch. Condition monitoring does not shorten the 340 hours by a minute; it moves them from a date the machine chooses to a date the planner chooses, and on this train that is worth more than any conceivable reduction in the work content.

The lube system shows the same principle achieved by architecture instead of instrumentation. Two pumps with one running means a 6-hour repair happens on a train that is still producing, so the duration never enters the production availability arithmetic at all. That is maintainability purchased with redundancy, and the emergency shutdown loop shows the third variant: partial stroke testing every three months exists because a full proof test of the shutdown valve would require the train to stop. A test regime designed around an access window, exactly as at the level crossing, with the safety case rather than the delay budget setting the interval.

Medical devices: infusion pump fleet

Six hundred pumps, one biomedical department, and a repair time that is almost the least interesting number in the room.

QuantityValue
Corrective active repair45 min
Preventive service30 min per pump, annually
Fleet failures a year (600 pumps at 3.65 each)about 2,190
Corrective labour a year1,643 h
Preventive labour a year300 h
No-fault-found on returned pumps17%
Loaner pool40 pumps

Add the two labour lines and the department carries roughly 1,943 hours a year on this one device type, which is on the order of one technician working full time on infusion pumps and nothing else. The preventive share is 15% of the labour while touching 100% of the fleet, which is the classic reading trap in preventive figures: 30 minutes sounds trivial per action, and the burden is set by frequency multiplied by duration, not by duration alone. The battery is the item to watch in that ledger, at 800 of the pump's 1,460 per 10⁶ hours, more than half the failure rate, sitting on a two-year replacement cycle; tightening that interval moves work out of the corrective column and into the preventive one, which is a workload decision as much as a reliability one.

Seventeen per cent of returns are no-fault-found, and the honest reading of them is that they are mostly setup error reported as device failure. If the 2,190 genuine failures are the other 83%, the bench sees about 2,640 units a year and roughly 450 of them are healthy. Those 450 events each consume the 45 minutes, produce nothing, and arrive as work orders rather than as training requests. It is worth sitting with that: the maintenance queue of this fleet is contaminated by roughly one non-fault in six, and the fix lives in usability engineering and ward training, not in the workshop. The safety analysis reaches the same conclusion from the other direction, finding use-related causes behind about four fifths of the over-infusion hazard.

The constraint that dominates everything else, though, is permission. The hospital repairs to board level under the manufacturer's service policy, and that policy is the reason the 45-minute figure exists at all. Withdraw board-level authorisation and the active repair time does not change by a second while the downtime becomes a shipment, a queue at a service centre and a return leg. The fleet absorbs this through float rather than speed: 40 loaners against 600 pumps, a 6.7% pool, holds fleet availability at 0.982 where its absence would give 0.943. Almost four percentage points of fleet availability bought with spare machines rather than with faster repairs is the honest summary, and it is why the level-of-repair question for medical fleets is usually settled by service policy and capital budget rather than by technical time.

Electronics and high tech: storage array controller pair

Nothing here is ever unplugged from a dead machine, and that single fact rewrites the maintainability model.

ItemRateService action
Controller board3,000 FIT (3.0 per 10⁶ h)hot swap, active-active pair
Power supply1,500 FIThot swap
Drive0.4% annualised failure ratehot swap, routine and expected
Lithium backup unit900 FITprocedure-controlled, energy-storage hazard
On-site response4 hthe only elapsed term in the model
Single controller unavailabilityq = 1.2 × 10⁻⁵4 / (333,333 + 4)

That last line is worth unpacking because it is the whole argument. A controller at 3.0 per 10⁶ hours has a mean life of 333,333 hours, and its unavailability of 1.2 × 10⁻⁵ comes from dividing the four-hour on-site response by that life plus the four hours. Active repair time appears nowhere. The four hours in the expression is a contract response commitment, not a repair duration, because the repair itself is a hot swap performed while the array continues serving. Hot-swap does not make repair fast; it removes repair from the availability equation and replaces it with detection and dispatch, and every improvement worth funding therefore lands on monitoring coverage, alerting latency and courier logistics rather than on anything a technician does with their hands.

The programme consequences are peculiar. There is very little to demonstrate with a stopwatch, so the maintainability evidence becomes coverage and dispatch performance instead of inserted-fault trials: 97% detection coverage from telemetry and drive self-monitoring, plus a response-time service level that is procured rather than engineered. Drives make the point most sharply, since at 0.4% annualised failure rate across a populated array their replacement is a routine event rather than an incident, and the design work went into making that a customer action with no service call attached.

The bill arrives as parts. No-fault-found on returned units runs at 24%, the highest of the eight rows and the dominant warranty cost, and the reason is structural rather than careless. When swapping costs nothing in downtime, it is done on suspicion, and a free swap is paid for in inventory. Set the three no-fault-found figures in this chapter side by side (24% here, 21% on dealer brake ECUs, 17% on hospital pumps) and the ordering follows the cheapness of the swap almost exactly. The exception in this row is the lithium backup unit, whose thermal runaway mode makes its removal a procedure with handling constraints: the one component that cannot be casually exchanged is the one where safety, not availability, writes the maintenance instruction. And the array's largest single maintenance risk is not a failure at all. A disruptive 20-minute firmware update spends four years of a 5.3-minute annual budget in one sitting, which is why rolling, non-disruptive update is a maintainability feature bought and paid for in the architecture.

Nuclear: emergency diesel generator train

A standby machine maintained on the plant's calendar rather than its own, under two constraints that most industries never price.

QuantityValue
Monthly surveillance start2 h unavailable, 12 a year = 24 h
Surveillance unavailability24 / 8,760 = 2.7 × 10⁻³
Allowed outage time for corrective work72 h
Undetected dangerous λ between tests45 per 10⁶ h
Test interval T730 h
Latent contribution λT/21.6 × 10⁻²
Support systems: fuel oil, starting air, load sequencer250, 180, 60 per 10⁶ h

The 72-hour allowed outage time is not a target and not a mean. It is a ceiling written into the technical specifications with a plant shutdown behind it, which makes the governing requirement a percentile rather than an average, and a very high percentile at that. Planning against it looks nothing like planning against an MTTR: parts are pre-staged before the work starts, the task sequence is rehearsed, contingency branches are agreed at the outset, and a job whose worst case might exceed 72 hours is not begun until the outage window can cover it. This is the mean-versus-percentile distinction from the foundations chapter with a regulatory edge, and it is the clearest example in this chapter of why a specification that quotes only MTTR has bought the wrong property.

The second constraint is the test interval, and it is genuinely two-sided. The undetected dangerous rate of 45 per 10⁶ hours over a 730-hour interval gives a latent contribution of 1.6 × 10⁻², and the obvious response is to test more often. Do the arithmetic on halving the interval to 365 hours and the latent term falls to 8.2 × 10⁻³, while the surveillance itself rises from 24 to 48 hours a year and its unavailability from 2.7 × 10⁻³ to 5.5 × 10⁻³. Testing buys detection and spends availability, both sides of the trade are maintenance work executed by the same crew, and the optimum sits where the two curves cross rather than at either extreme. It looks like a testability decision and it is settled with maintainability numbers.

The third constraint has no clock at all. Work on this train is planned into the refuelling outage where possible, and dose accumulated during the work is a first-class cost alongside elapsed time. The objective function is therefore not minimum duration but minimum dose subject to the time bound, and the design levers do not change while their ranking does. A layout change that saves twenty minutes at the price of an awkward posture in a higher-dose area is a good trade in seven of these eight rows and a bad one here. When maintenance is priced in something other than hours, the task analysis rather than the repair-time prediction becomes the governing document, because only the task analysis carries the posture, position and duration detail that a dose estimate needs.

What the eight rows have in common

Read down the column and one finding repeats in every row: the active repair time was the smallest term in the answer. The aircraft's 1.5-hour removal sits inside a 27.5-hour outstation downtime. The crossing's 2.5-hour repair sits inside a 9.5-hour possession cycle. The satellite has no repair at all and spends 4 of its 7.2 restoration hours deciding. The vehicle's 1.2 hours is 3.6% of a 33.6-hour vehicle-off-road event. The compressor's decisive number is not a duration but a placement inside a 21-day window. The pump's 45 minutes matters far less than a 40-unit loaner pool and a service policy. The array's repair time is literally absent from its availability arithmetic. The diesel's work is bounded by a 72-hour ceiling and priced in dose. A maintainability programme that optimises the wrench and ignores the wrapper will, on this evidence, spend its budget on somewhere between nothing at all and a quarter of the problem.

The second finding is that the decisive lever was different every time, which is why eight rows exist rather than one. Weighting the roll-up by failure rate named the aircraft's real offender; access windows dominated the crossing; decision quality and the definition of the end state governed the satellite; diagnostic resolution drove the vehicle's parts pipeline and its warranty bill; calendar placement was the compressor's entire answer; permission and float carried the pump fleet; swap architecture deleted the array's repair term and inflated its no-fault-found rate; and a hard outage ceiling with a dose budget reordered the diesel's design priorities. None of these is derivable from a repair-time table, and all of them are visible the moment the maintenance concept is written down.

That is the argument for reading the other four columns. A repair time that is correct in isolation can still describe a property nobody experiences, and what the operator actually feels is assembled from the failure rates in reliability, the downtime accounting in availability, the consequence classes in safety and the diagnostic coverage in testability.


Want to see this on a live system model? Request a walkthrough.