

The analysis has three moving parts: what a level actually is, what an option costs to own, and which of the two evaluations, non-economic or economic, gets to decide.
The three levels, and what the letters mean
The classical maintenance structure has three levels, and the abbreviations are used constantly in this field without being spelled out:
| Level | Also called | Where it is | What it does |
|---|---|---|---|
| O, organisational | Unit, flight line, first line, on-equipment | Wherever the equipment is operated, by its own crews | Remove and replace, servicing, adjustment, operational checks. Off-equipment repair is not its job |
| I, intermediate | Field, base workshop, second line, off-equipment | One shop per operating base or per formation | Bench repair of items removed at O level: strip, replace a module, reseal, test and return to base stock |
| D, depot | Overhaul, third and fourth line, national or supplier facility | One site nationally, or the manufacturer under contract | Everything that needs the heavy rigs, the certified benches, the release authority or the specialist skills |
The published decision logic uses exactly these three. An item's outcome is either discard, or repair resolved to exactly one of organisational, intermediate or depot, and the analysis is not finished until it names one of the four.
A programme does not have to have all three. Two-level support (organisational and depot, with no intermediate shop) is now common, because a single well-equipped depot with fast transport can beat a chain of half-used workshops. Four-level structures exist where a service distinguishes a national depot from a manufacturer's overhaul facility. How many levels exist is a maintenance concept decision, made before the analysis; which level each item lands at is what the analysis decides.
Other vocabularies exist for the same structure, and the mapping between them is approximate rather than exact: UK defence usage has its own terms and has changed them more than once, and civil aviation talks about line maintenance, base maintenance and shop or component maintenance. When reading somebody else's analysis, check what their levels are rather than what they are called.
A level is really a number of sites
The hierarchy is easier to reason about as a count:
| Level | Sites | Turnaround | Capability cost |
|---|---|---|---|
| O | Wherever the fleet is | Immediate | Multiplied by everywhere |
| I | One per operating base | Days | Multiplied by the number of bases |
| D | One, or a contracted facility | Weeks, including freight both ways | Bought once |
Every fixed cost in the model is multiplied by the number of sites at that level, and every pipeline is set by the turnaround. Those two facts, pulling in opposite directions, are the whole tension of the analysis. A capability close to the equipment is fast and multiplied; a capability far from it is cheap and slow, and the slowness is paid for in stock.
The quantity being compared
Not the cost of a repair. The annual cost of owning the option, over the support life, discounted to something comparable:
| Element | Discard | Repair at a level |
|---|---|---|
| Replacement units | demand × unit price | none |
| Repair labour and materials | none | demand × (materials + hours × rate) |
| Transport | none | demand × round trip, where the level is remote |
| Pipeline spares | procurement lead time | turnaround, which is where the level shows up |
| Test and support equipment | none | per site, plus calibration every year |
| Training | none | per site, and again as people rotate |
| Technical data | none | a repair procedure to the depth that level works to |
| Facilities | none | bench, bay, power, clean area where needed |
| Disposal | per unit, and controlled waste costs more | on scrapped parts only |
The pipeline term is the one that connects this analysis to availability. An item away for repair has to be replaced from stock, so the expected number in the pipe is demand × turnaround ÷ 365 plus a safety allowance, priced at the unit price. A long depot turnaround buys cheap labour with expensive stock, and an analysis that leaves the pipeline out will send everything to the depot.
A note on where that element list comes from. The active standard is deliberately process-oriented and does not prescribe a cost model, so the table above is the shape ordinary practice uses rather than a reproduction of any one standard's equations. Two organisations' models will differ in how they treat shared equipment, how deep they take the pipeline calculation and whether they carry facilities at all. What does not differ, and what a reader should check first in somebody else's analysis, is whether the fixed costs are in there and how many sites they were multiplied by.
Where the money actually goes
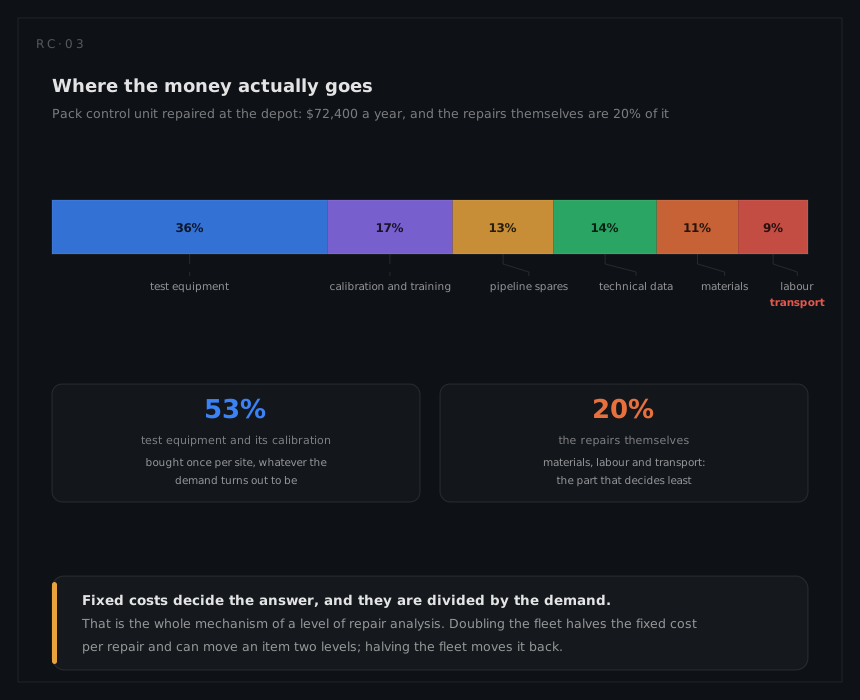
This is the mechanism worth internalising, because it explains every counter-intuitive result the analysis produces:
- Fixed costs dominate, and they are divided by demand. Doubling the fleet halves the capability cost per repair.
- Cheap items are discarded not because they are cheap to buy but because the capability to fix them costs the same as the capability to fix expensive ones.
- Site count is a multiplier on the fixed costs, so three workshops need three times the tester, three times the training and three sets of the manual, against one pipeline that is five times shorter.
Marginal cost, and the argument that hides inside it
A test rig the base already owns for another system costs this item its fixture and its calibration. The same rig, if this item is the only reason to buy it, costs its whole price. Both treatments are defensible and they can put the item at different levels.
The rule that keeps this honest is to charge what the decision actually adds, and to say in the report which treatment was used. Where several candidate items would share one rig, charging each of them the full price gets every one of them wrong, and the correct treatment is either an allocation or an evaluation of the items together.
Non-economic factors, and what they are for
Some options are not available at some levels for reasons that have nothing to do with money:
| Factor | Typical effect |
|---|---|
| Safety and certification | Release to service after repair may need an approval only one level holds |
| Security and export control | The item, its data or its tooling may not be held at every site |
| Technology and capability | A process, a rig or a skill the level cannot realistically sustain |
| Policy and doctrine | The support policy assigns classes of work to levels |
| Environment and disposal | Controlled waste has a route, and discard may not be permitted locally |
| Transportability | Some items cannot practically be moved to a distant facility at all, which most models screen inside the technology and capability question |
The published logic runs the non-economic evaluation without consideration of costs, and then runs the economic evaluation anyway. That second half is what turns a constraint from a fact into a decision: if the constraint removed the cheapest option, the difference is the annual price of the constraint, and it belongs in the report next to the recommendation.
The decision is a property of the support system
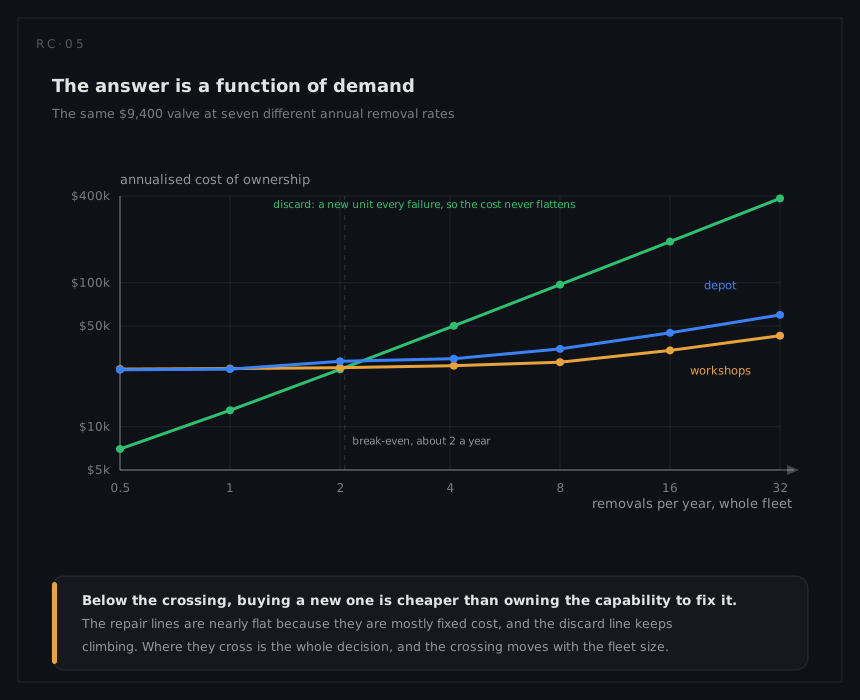
Two sweeps say almost everything about an item:
- Against demand. Below the crossing, buying a new one is cheaper than owning the ability to fix one. The crossing moves with the fleet size, so the same item is a discard on a small fleet and a repair on a large one.
- Against unit price. Below the crossing, the capability costs more than the parts it saves.
Neither crossing is a fact about the engineering. Both are facts about the support system: the price of the rig, the number of sites, the length of the pipeline and the cost of money.
Indenture levels
The analysis repeats at every level of the breakdown, and the answers do not have to agree. A unit repaired at the depot will often have most of its modules discarded there, which sounds contradictory and is the normal result: repairing the unit is replacing a module.
What the parent's answer fixes is not the child's answer but where the child's question is asked, and what the child's answer fixes is what that site has to stock. Where several items would share a capability, the honest treatment is to evaluate the combinations rather than the items one at a time, which is what the published optimisation formulations of the problem do.
What the analysis assumes, and rarely says
| Assumption | Why it matters |
|---|---|
| The maintenance concept | The number of levels and sites is an input, not an output |
| The horizon and the discount rate | A long horizon at a low rate buys capability a short one refuses |
| Steady-state demand | Fleets ramp up and wind down, and the analysis usually ignores both |
| One deployment posture | Peacetime and deployed support are different analyses of the same fleet |
| Repair is possible | Whether the item is technically repairable at all is an engineering input |
Every one of these belongs on the front page of the report, because a reader who disagrees with the recommendation is nearly always disagreeing with one of them rather than with the arithmetic.