

The analysis produces one letter-sized answer per item and a great deal of commitment behind it. What matters is that the answer travels as an instruction rather than as a recommendation in a report nobody reads twice.
1. The decision, per item
Repair or discard, and if repair, at exactly one level. Recorded against the item in the logistics record, with the evaluation that produced it: the option costs, the margin over the next option, and whether a non-economic factor decided it.
The margin belongs in the answer. A recommendation that wins by two per cent and one that wins by a factor of three are different results, and only one of them is worth defending against a change in the demand estimate.
2. The maintenance planning products it feeds
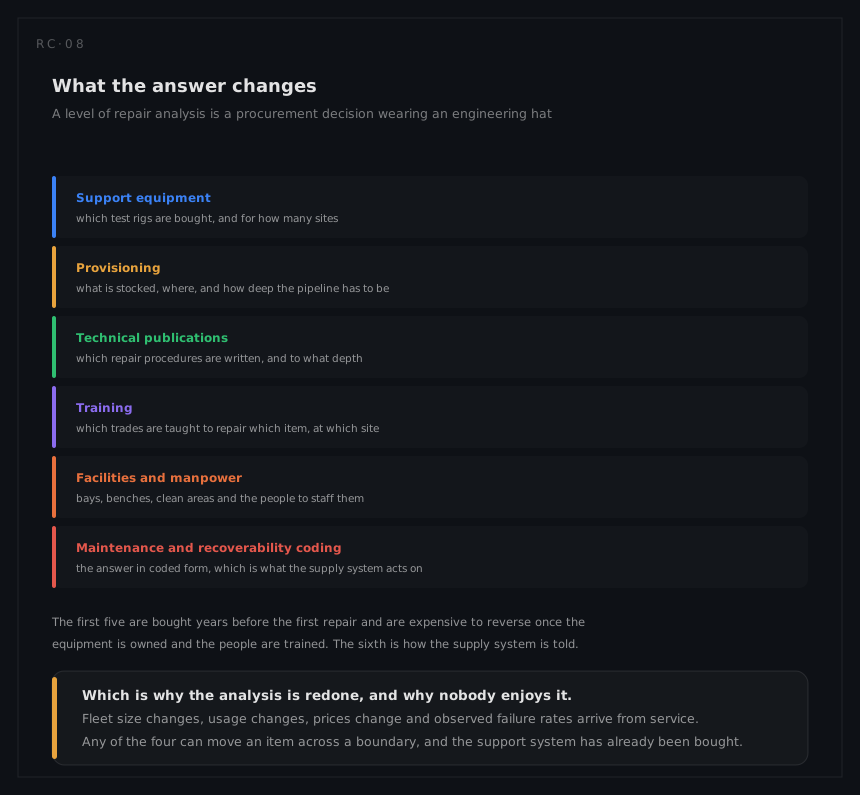
This is where a LORA stops being an analysis and becomes the support system:
| Product | What LORA supplies |
|---|---|
| Maintenance allocation | Which level performs which task, item by item |
| Source, maintenance and recoverability coding | The maintenance portion of the code, which is the LORA answer in coded form |
| Task analysis | The maintenance level each task is then analysed at |
| Provisioning | What is stocked, at which sites, and how deep the pipeline must be |
| Support equipment | The procurement list, with quantities per site |
| Technical publications | Which repair procedures are written, and to what depth |
| Training | Which trades learn which repairs, at which sites |
The coding step is worth naming because it is how the decision becomes durable. In US practice and in the UK practice that adopted the same construct, the analysis is the documented basis for the maintenance portion of the item's code, and the codes are what the supply system actually acts on years later, long after the study has been archived.
The code is read in positions rather than as a word, and only some of it is the analysis's to set:
| Position | What it records | Whose answer it is |
|---|---|---|
| Source | How the item is obtained: bought, made, assembled, or drawn from a kit | Procurement and design |
| Maintenance, remove and replace | Which level is authorised to take the item off and put a new one on | The maintenance concept, with the task analysis behind it |
| Maintenance, repair | Which level is authorised to do the complete repair, or that no repair is authorised at all | This analysis |
| Recoverability | What happens to an item that is beyond repair at that level: condemned where it is, or sent up for disposal | This analysis, and the disposal route |
Two of the four are the LORA answer written down. Getting the repair position wrong is how a fleet ends up with a manual it never uses, or a workshop asking for a rig nobody bought.
3. The economics, reported as a comparison
| Output | Why it is reported |
|---|---|
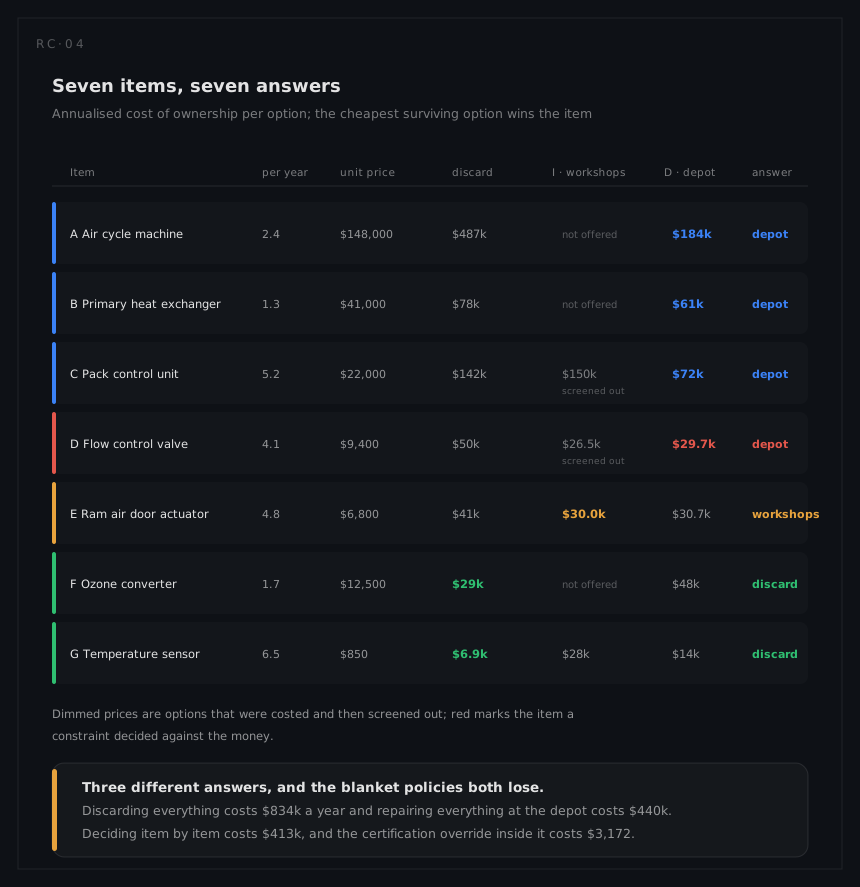
| Cost of each option, per item | So the reader can see what was compared, not just what won |
| Cost of the chosen policy against blanket alternatives | The size of the prize, and the argument for doing the work at all |
| Price of each non-economic constraint | What relief from that constraint would be worth per year |
| Break-even points on demand and price | What would have to change for the answer to change |
4. Sensitivity, as a standing output
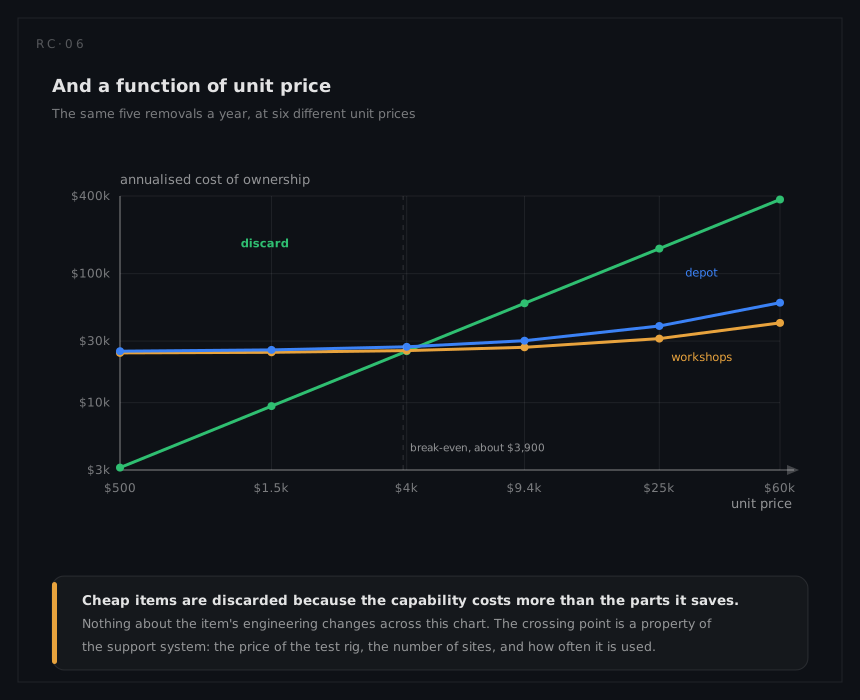
The break-evens are the part of the analysis with the longest useful life. They convert the next review from a repeat of the study into four checks: has the fleet changed, has usage changed, have prices changed, has the observed failure rate changed. Any of the four crossing a boundary is the trigger to re-run.
What the results do not support
- They are not an availability statement. The cheapest support system is often the slowest. A depot answer with a long pipeline can be the right economics and the wrong operational outcome, and the analysis will not say so unless somebody asks it to.
- They are not a spares plan. LORA sizes the pipeline its own answer implies; range and depth across the whole fleet is a separate optimisation that interacts with this one.
- They do not transfer between fleets. The same item on a different fleet size, site count or usage rate is a different answer with the same engineering.
- They are not stable across the programme. Development estimates of demand are the least reliable input and the most decisive one, which is why the marginal items are worth flagging as items to watch rather than as items decided.
- They cannot repair a maintenance concept that does not fit. If the levels are wrong for how the fleet is actually operated, the analysis will optimise inside a structure that should have been changed, and produce a defensible answer to the wrong question.