

The deliverable is a set of records, one per task, and almost nobody reads them as a document. They are read as inputs by six other activities, each taking a different column.
1. The task record itself
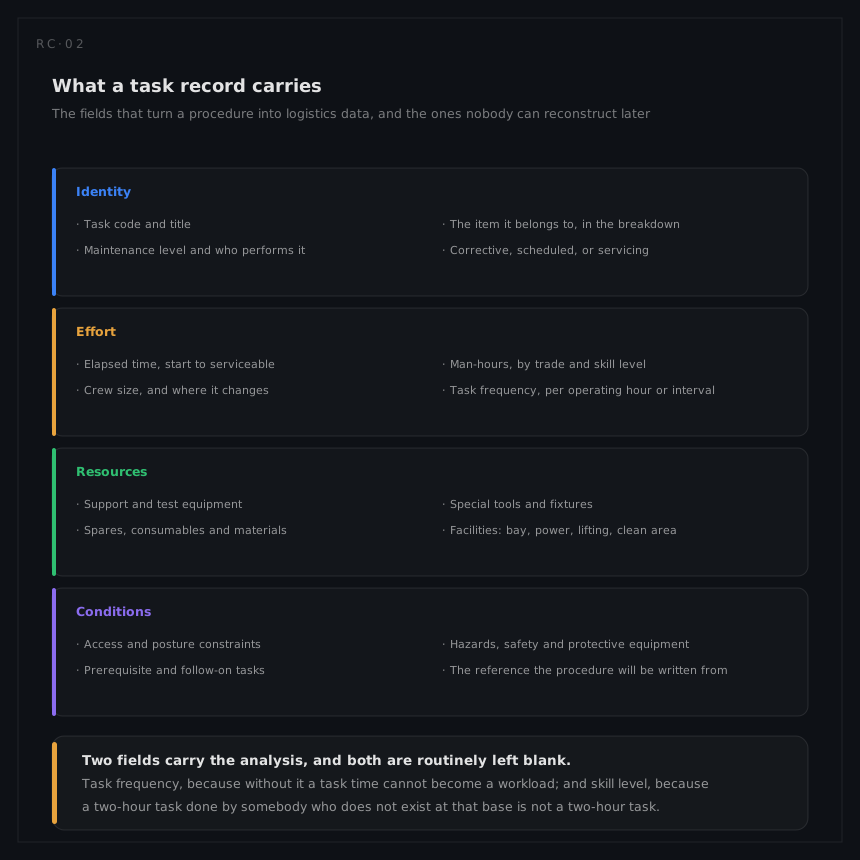
Identity, effort, resources and conditions, structured rather than written as prose. The structure is what allows a provisioning demand, a support equipment list and a manpower estimate to be derived rather than compiled, and it is why the data standards specify tables and named elements instead of a report format.
2. Two times and a frequency, per task
| Output | Consumer |
|---|---|
| Elapsed time | Availability, turnaround, maintenance planning |
| Man-hours, by trade and skill | Manpower establishment, shift planning, support contracts |
| Frequency | Everything that needs a workload rather than a duration |
Reported together, always. The three are the analysis's signature, and any two of them without the third support a decision somebody will get wrong.
3. A workload, at system and fleet level
annual man-hours by task, by trade, by level, and MMH per operating hour for the system. On the worked example this comes out at 238.5 man-hours a year and 0.0110 MMH per flight hour, of which 69 per cent is scheduled work, which is the sort of split that changes what a programme argues about.
4. Resource requirements, quantified and located
| Output | Form |
|---|---|
| Support and test equipment | A list with quantities per site, and the tasks that justify each item |
| Special tools | The same, and usually the items nobody else would have asked for |
| Spares and consumables | Demand per task, which becomes demand per year through the frequency |
| Facilities | Bays, benches, power, lifting and clean areas, each traced to its tasks |
| Skills | Trades and levels, including any that do not exist yet and have to be created |
Each of these is a justification as much as a list. The data standards ask for facilities and new skills to be recorded as consequences of the task analysis, which means the answer to "why are we buying this" is a task identifier rather than an opinion.
5. Inputs to the analyses downstream
| Consumer | What it takes |
|---|---|
| Maintainability prediction | Task times, weighted by frequency, to produce MTTR and its percentiles |
| Level of repair analysis | Task times and resources at each candidate level, and the fixed costs each level implies |
| Availability modelling | Elapsed times, and the downtime the fleet actually sees |
| Technical publications | The validated step sequence, with cautions and prerequisites |
| Training | The tasks, the skills, and the hours each trade will spend |
| Provisioning | Demands per task, and the range and depth those imply |
What the results do not support
- They are not a measured MTTR. Predicted times weighted by predicted rates give a predicted mean. The demonstration measures it, and the field corrects it.
- They are not a maintenance schedule. The analysis says what a task costs; when tasks are grouped into packages, and how they share access, is maintenance planning and it uses these numbers as inputs.
- They do not prove a task is worth doing. A scheduled task with a well-analysed 4.5 man-hours is still a task somebody chose. The interval and the justification belong to the preventive maintenance analysis.
- They are not valid across configurations. A task analysed on one build standard is an estimate on another, and the difference is usually access rather than the work itself.
- They are not true until walked. Before validation the numbers are a structured argument. After validation they are a record, and the difference between the two is the point of the event.