

The maintainability concept page defines the property: the repair-time distribution, its mean, its percentiles, and why a lognormal describes it. Those are measurements. This module is how the same numbers are produced from a design nobody has built yet, and the method is unglamorous: list the repairs, break each into the activities a technician performs, put a time on every activity, and weight the totals by how often each repair happens.
That last clause is the whole discipline. A repair that takes two hours and never happens costs nothing; one that takes ten minutes twice a week costs more than most people expect. The prediction is therefore not an average of repair times but a failure-rate-weighted average, and the ranking it produces routinely disagrees with the reliability programme's.
What the analysis produces
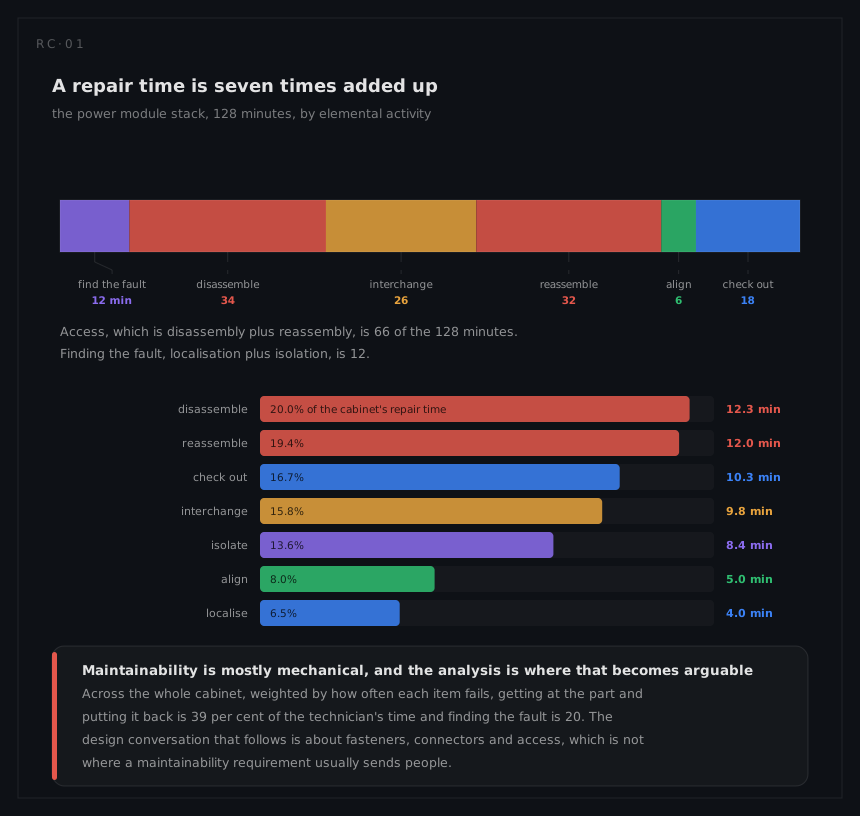
Two numbers and a list:
| Output | What it is |
|---|---|
Mct, mean corrective maintenance time | Σ λᵢ tᵢ ÷ Σ λᵢ, the number a specification usually names |
Mpt and M̄ | The preventive mean, and the mean over all maintenance actions |
MMH/OH | Maintenance man-hours per operating hour, crew size included: the manning estimate |
Mmax at a percentile | The 90th or 95th percentile of the fitted distribution, which is what sizes a maintenance window |
| The contribution list | Which items and which activities consume the time, which is what a designer can act on |
Where the method comes from
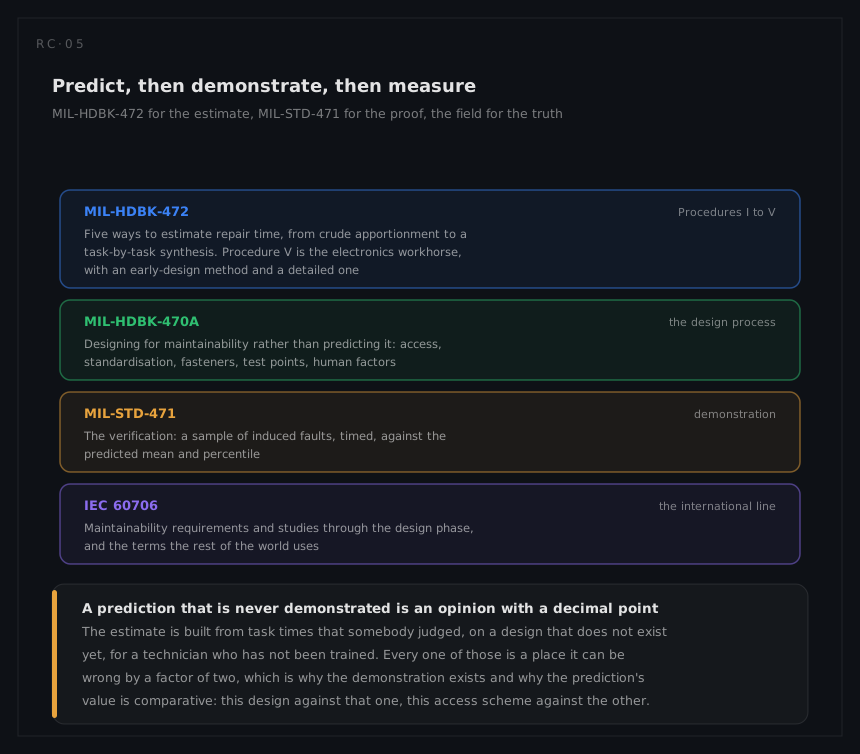
MIL-HDBK-472 is the source of the technique. The 1966 handbook carries four procedures and Notice 1 of 1984 added a fifth, and they differ in the equipment they were written for, in how much design detail they need and in how much confidence they return. Procedure V is the one most electronics programmes use: it synthesises a repair time task by task, and it comes in an early-design method and a detailed one. The others range from an estimate built on experience with a predecessor to a checklist score converted to time by regression, and choosing among them is a statement about how much design there is to analyse.
MIL-HDBK-470A is the other half and is often the more useful document: it is about designing for maintainability rather than predicting it, which is access, standardisation, fastener count, test points and the human at the end of the screwdriver. A prediction that produces a bad number and no design change has been run for its own sake.
MIL-STD-471 is the demonstration: a sample of induced faults, timed on real hardware by representative technicians, against the predicted mean and percentile. IEC 60706 carries the international treatment of maintainability requirements and studies through the design phase.
Where it sits in the programme
The prediction needs a maintenance concept, a repair-level decision and a parts list with failure rates, so it starts later than derating and earlier than any hardware exists. It is at its most useful when two design options are still open, because its absolute accuracy is modest and its comparative accuracy is good: this access scheme against that one, a plug-in card against a bolted assembly.
| Programme stage | What the prediction is for |
|---|---|
| Preliminary design | Comparing arrangements; establishing whether the MTTR requirement is even plausible |
| Detailed design | The full task-by-task synthesis, with the contribution list driving access decisions |
| Verification | The baseline the demonstration is measured against |
| In service | Corrected by observed repair times, which is when the assumptions get graded |
Its inputs come from three places. The failure rates come from the prediction, so the weighting is consistent with everything else. The fault-isolation performance comes from testability analysis, which is what makes the isolate activity short or long. And the task list itself comes from the maintenance concept, or from a maintenance task analysis where one exists.