

The procedure is short and its inputs are not. Most of the effort is in deciding what a repair actually consists of, and most of the error is in deciding it optimistically.
1. Fix the maintenance concept first
Nothing can be estimated until four things are settled, and they are programme decisions rather than analysis ones:
| Decision | Why the estimate depends on it |
|---|---|
| The level of repair | Replacing a card and replacing the cabinet it sits in are different tasks |
| Who repairs, and with what training | The same task has different times for a technician and a specialist |
| Where, and with what access | On the vehicle, in a workshop, at a depot: different disassembly entirely |
| What counts as complete | Powered up and checked out, or swapped and released |
2. Choose the procedure the design can support
MIL-HDBK-472 offers five, and the choice is a statement about how much design exists. A task-by-task synthesis on a block diagram is false precision; an estimate from experience with a predecessor, on a design detailed enough to walk through, throws away what is known. Record which procedure was used, because two predictions produced by different procedures are not comparable.
The requirement itself arrives before any of this. A system MTTR or Mmax target is apportioned down the product structure first, so that each assembly has a repair-time budget the prediction can be measured against; that apportionment is a design activity rather than a prediction one, and it is treated on the maintainability design page. Predicting without a budget produces a number nobody can call good or bad.
3. List the repairs, from the items that fail
The repair list is the replaceable-item list, with a failure rate on each from the prediction. Where one item has genuinely different repairs depending on the mode, which the FMECA will already have identified, it becomes two rows with the mode's share of the rate.
4. Time each elemental activity
The seven activities, per repair, from a task-time library, a comparable design's measured times, or a walk-through on a mock-up. Two disciplines: estimate the activities separately rather than the total, because a total is a guess and seven parts are an argument; and record the basis of each, because a time from a measured predecessor and a time from imagination should not look alike in the table.
The isolation time deserves its own sentence. It is where the testability analysis lands: a fault isolated to one item takes minutes, and one isolated to a group of three takes the swap-and-retry cycle the ambiguity implies. Taking that number from the dependency model rather than inventing it is what keeps the two analyses consistent.
5. Weight, and produce both numbers
Mct = Σ λᵢ tᵢ ÷ Σ λᵢ for the mean, and the lognormal fit on the logarithms for the percentile. Report both, with the percentile's confidence level named. A single MTTR figure answers only half of what a maintenance concept needs to know.
6. Read the contribution list, which is the actual output
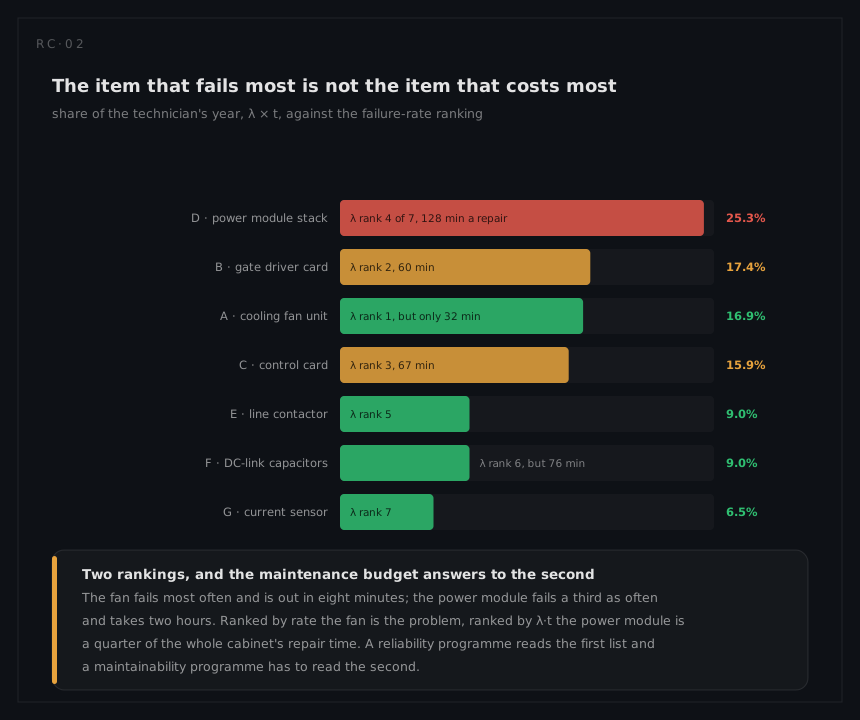
Sort by λᵢ tᵢ, and separately sum each elemental activity across the whole equipment. Those two sorts answer different design questions:
| Sort | The question it answers |
|---|---|
By item, λ·t | Which item's repair should be made easier, or which item should fail less |
| By activity, summed | Whether the design problem is access, diagnosis, alignment or checkout |
The second is the one that changes enclosures. If disassembly and reassembly dominate, no amount of built-in test will help, and the finding belongs to the mechanical designer.
7. Compare against the requirement, and act

A prediction over the requirement has four honest responses, and they are ordered by cost: change the access, change the item boundary so less has to come apart, change the diagnostic so isolation is shorter, or renegotiate the requirement with the evidence attached. Guessing lower task times is not on the list.
8. Demonstrate, then correct
The prediction is a hypothesis. MIL-STD-471 turns it into evidence: a sample of induced faults, timed on hardware, by people representative of the ones who will do it.
Three things have to be agreed before the first fault is inserted, and they are what make the result a decision rather than an anecdote. How the sample is drawn: faults are selected in proportion to predicted failure rate, so the tasks that are timed occur in the mix the prediction was weighted by, and a rare long repair does not dominate a small sample. How many tasks: the number follows from the discrimination wanted, because the sample mean of a skewed distribution settles slowly and a short demonstration cannot separate a compliant design from a marginal one. What the test decides: the observed times give a sample mean and a sample percentile, and each is compared with the predicted value as a hypothesis test at agreed producer's and consumer's risks, so that both parties know before the test what result would fail it.
The comparison is worth as much for the task-time library as for the programme, because a library corrected by one demonstration predicts the next design better.