

Consider the traction converter cabinet of a rail vehicle: the power electronics that take the line supply and drive the motors, maintained in a depot road with the vehicle out of service. Seven replaceable items, 123 failures per 10⁶ hours between them. Every value is an illustrative teaching figure; the arithmetic is MIL-HDBK-472's.
The maintenance concept, settled first: repair by replacement at item level, by a depot technician with the vehicle stationary and the cabinet accessible from one side, complete when the converter has passed its power-on check.
The task times
Each repair broken into its elemental activities, in minutes:
| Item | λ | loc | iso | disas | inter | reas | align | check | Total |
|---|---|---|---|---|---|---|---|---|---|
| A · Cooling fan unit | 40 | 4 | 3 | 6 | 8 | 6 | 0 | 5 | 32 |
| B · Gate driver card | 22 | 4 | 14 | 10 | 6 | 10 | 4 | 12 | 60 |
| C · Control card | 18 | 4 | 9 | 8 | 5 | 8 | 18 | 15 | 67 |
| D · Power module stack | 15 | 4 | 8 | 34 | 26 | 32 | 6 | 18 | 128 |
| E · Line contactor | 12 | 4 | 7 | 12 | 9 | 12 | 5 | 8 | 57 |
| F · DC-link capacitor bank | 9 | 4 | 6 | 22 | 14 | 20 | 0 | 10 | 76 |
| G · Current sensor | 7 | 4 | 26 | 9 | 5 | 9 | 7 | 11 | 71 |
Three rows are worth reading before any arithmetic. The fan is the most frequent failure and the quickest repair, because it was designed to be swapped. The power module is a two-hour job dominated by getting at it and putting it back. And the current sensor has a 26-minute isolation time, four times anyone else's, which is not a mechanical property at all: it is the ambiguity group the testability analysis would have found.
That 26 minutes is a swap-and-retry cycle rather than a measurement. The diagnostic narrows a sensor fault to three candidates and no further, and with no reason to prefer one of them the technician replaces them in turn: the failed item is equally likely to be the first, second or third tried, so the average is (1 + 2 + 3) ÷ 3 = 2 removals per fault. Two consequences follow, and only the first is in the table. The isolation time carries the cost of the unnecessary removal, which is why it is 26 minutes and not 6. And the sensor's 7 failures per 10⁶ hours generate about 14 removals per 10⁶ hours across the three candidates, so the spares for that group are provisioned against a removal rate twice the failure rate. Spares follow removals, not failures, and the gap between the two is the ambiguity.
The mean, weighted properly
Mct = Σ λᵢ tᵢ ÷ Σ λᵢ = 7,591 ÷ 123 = 61.7 minutes = 1.03 hours
The unweighted average of those seven totals is 70.1 minutes, which is the number a spreadsheet gives and no technician experiences. The difference is the fan: the most common repair is also the shortest, and the weighting is what notices.
The distribution, and the number the contract wants
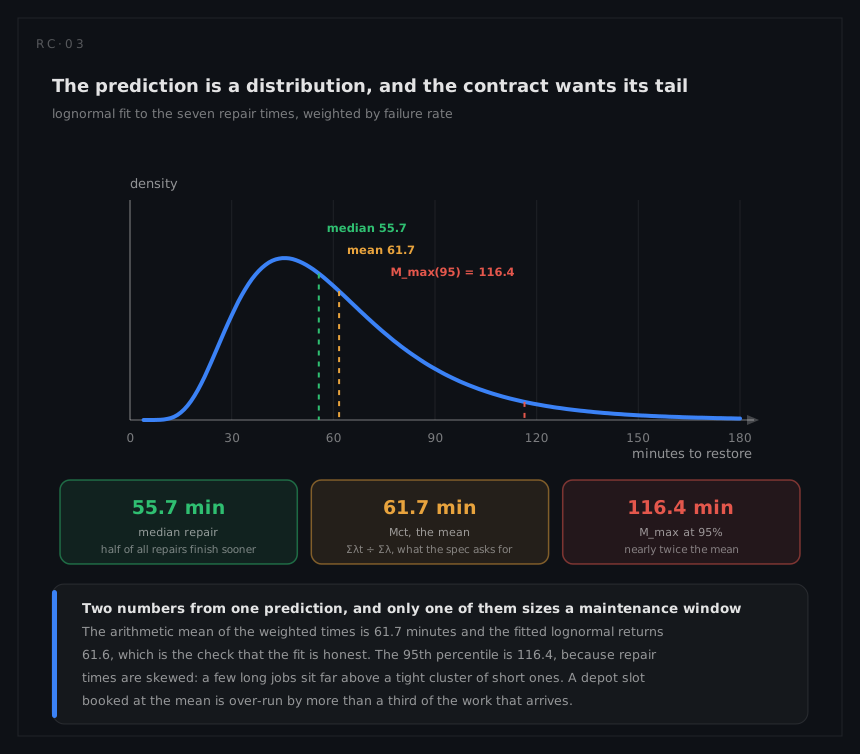
Fitting on the logarithms, weighted the same way:
μ = 4.0203, σ = 0.4481
| Quantity | Value |
|---|---|
Median, e^μ | 55.7 min |
Mean, e^(μ + σ²/2) | 61.6 min |
Mmax at 90 per cent | 99.0 min |
Mmax at 95 per cent | 116.4 min |
The fitted mean of 61.6 against the weighted arithmetic mean of 61.7 is the internal check that the lognormal is describing this mix honestly. And the 95th percentile is nearly twice the mean, which is the number a depot slot has to be sized on.
Where the time actually goes
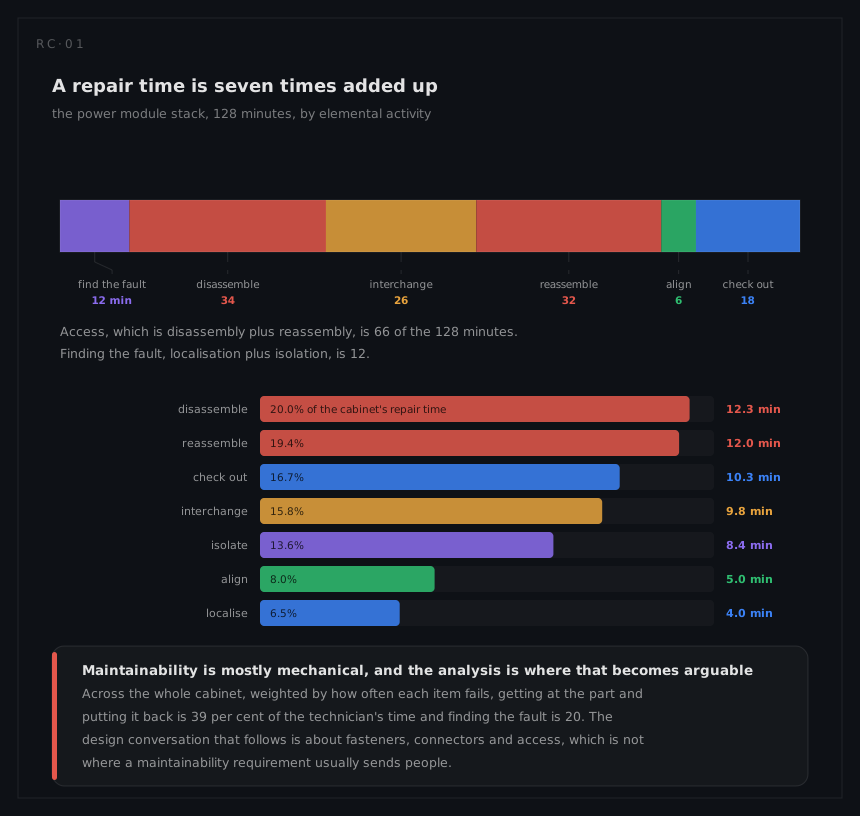
Two sorts of the same table, and they say different things.
By item, weighted by λ·t, the ranking is not the failure-rate ranking:
| Item | Share of the technician's year | Failure-rate rank |
|---|---|---|
| D · power module stack | 25.3% | 4 of 7 |
| B · gate driver card | 17.4% | 2 |
| A · cooling fan unit | 16.9% | 1 |
| C · control card | 15.9% | 3 |
| E · line contactor | 9.0% | 5 |
| F · DC-link capacitors | 9.0% | 6 |
| G · current sensor | 6.5% | 7 |
The power module fails a third as often as the fan and consumes half again as much of the year.
By activity, summed across the cabinet and weighted:
| Activity | Weighted mean | Share |
|---|---|---|
| Disassembly | 12.3 min | 20.0% |
| Reassembly | 12.0 min | 19.4% |
| Checkout | 10.3 min | 16.7% |
| Interchange | 9.8 min | 15.8% |
| Isolation | 8.4 min | 13.6% |
| Alignment | 5.0 min | 8.0% |
| Localisation | 4.0 min | 6.5% |
Access is 39.4 per cent of the time and diagnosis is 20.1. That is the finding, and it belongs to whoever designs the enclosure.
What a perfect diagnostic would be worth

Suppose the testability work succeeds completely: every fault isolated to one item in five minutes, including the current sensor's 26.
Mct: 61.7 → 57.7 minutes, a 6.5 per cent cut · Mmax(95): 116.4 → 106.1 minutes
Worth having, and smaller than most people expect. Diagnosis is a fifth of the technician's time on this cabinet, so perfecting it cannot buy more than a fifth, and it buys a third of that because most isolation times were already short.
Set it against one mechanical change: halving the power module's disassembly and reassembly, 66 minutes of its 128. That removes 33 minutes from a repair that arrives 15 times per 10⁶ hours, 495 λ-weighted minutes, and the perfect diagnostic removes exactly the same 495. On Mct the two are worth the identical 4.0 minutes, and on Mmax(95) the access change is slightly the better of the two, 101.6 minutes against 106.1, because it shortens the longest job rather than several short ones.
The two separate on the measure the support contract is priced on. The power module takes two people, so halving its access saves 990 man-minutes per 10⁶ hours against the diagnostic's 549: nearly twice as much labour for the same clock-time saving. Crew size is what breaks the tie, and it is invisible in Mct. Both changes are decisions about fasteners, clearances and test points taken while the cabinet is still a drawing.
The man-hours, which is what the support contract buys
Mct counts the clock. A support estimate counts people, so every task carries a crew size and the measure becomes maintenance man-hours per operating hour:
MMH/OH = Σ (λᵢ · tᵢ · cᵢ) + Σ (fⱼ · tⱼ · cⱼ) with t in hours, λ and f per hour
Two sums, corrective then scheduled, and the second one is not optional: it is taken further down this page and both are needed before the figure means anything. The corrective term first:
| Item | λ | t (min) | Crew | λ·t·c |
|---|---|---|---|---|
| A · Cooling fan unit | 40 | 32 | 1 | 1,280 |
| B · Gate driver card | 22 | 60 | 1 | 1,320 |
| C · Control card | 18 | 67 | 1 | 1,206 |
| D · Power module stack | 15 | 128 | 2 | 3,840 |
| E · Line contactor | 12 | 57 | 1 | 684 |
| F · DC-link capacitor bank | 9 | 76 | 2 | 1,368 |
| G · Current sensor | 7 | 71 | 1 | 497 |
| Σ | 10,195 man-minutes per 10⁶ h |
corrective MMH/OH = 10,195 ÷ 60 ÷ 10⁶ = 1.70 × 10⁻⁴, or 0.170 man-hours per 1,000 operating hours
The power module's two-person crew is why it takes 38 per cent of the corrective man-hours while carrying 25 per cent of the clock time. A measure that ignores crew size ranks it wrongly, and the labour estimate built on that ranking is short.
The preventive side, which is usually the larger one
| Task | Interval | Time | Crew | Frequency per 10⁶ h |
|---|---|---|---|---|
| Filter clean | 2,000 h | 20 min | 1 | 500 |
| Annual inspection | 8,760 h | 90 min | 2 | 114 |
Mpt = (500 × 20 + 114 × 90) ÷ 614 = 20,260 ÷ 614 = 33.0 minutes
preventive MMH/OH = (500 × 20 × 1 + 114 × 90 × 2) ÷ 60 ÷ 10⁶ = 0.509 man-hours per 1,000 h
Three quarters of the labour on this cabinet is scheduled work, and 83 per cent of the maintenance visits are preventive. A programme that predicts only corrective maintenance has estimated a quarter of its own manpower bill. That the scheduled tasks are worth doing at all is a reliability-centred maintenance question, and it is asked with these numbers in hand.
Everything together
| Measure | Value |
|---|---|
Mct, mean corrective time | 61.7 min |
Mpt, mean preventive time | 33.0 min |
M̄, mean active maintenance time | (123 × 61.7 + 614 × 33.0) ÷ 737 = 37.8 min |
Mmax(95), corrective | 116.4 min |
MMH/OH, corrective + preventive | 0.679 man-hours per 1,000 operating hours |
M̄ at 37.8 minutes is lower than Mct at 61.7, which surprises people until they see why: most maintenance actions on this cabinet are short scheduled ones, and the mean over all actions is dragged toward them. M̄ is not a repair time and must never be quoted as one, which is exactly what happens when a specification asks for "mean maintenance time" without saying which.
The same cabinet at three levels
The prediction above is an intermediate-level analysis: the vehicle is in the depot road and the technician replaces the failed item inside the converter. The other two levels give different numbers for the same failures:
| Level | Task | Time | What it is used for |
|---|---|---|---|
| Organisational | Swap the whole converter on the vehicle | 55 min | The vehicle's availability |
| Intermediate | Swap the failed item, as analysed above | 62 min | Workshop manning and turnaround |
| Depot | Repair the failed card to component level | 210 min | Repair cost and the scrap decision |
The availability arithmetic at the end of this chapter uses the intermediate figure, because under this cabinet's maintenance concept the vehicle stands in the depot road for the whole of that repair: the intermediate task is the action that returns it to service. On a fleet that swaps the whole converter and repairs it afterwards, the restoring action is the 55-minute organisational task and that is what the availability model takes instead. Stating the level is not a formality; it changes the number by a factor of four across the range.
What it means for availability
At 123 per 10⁶ hours the cabinet's MTBF is 8,130 hours, so at Mct = 1.03 h:
A = 8,130 ÷ (8,130 + 1.03) = 0.999873, about 66 minutes of downtime a year
and with the isolation fix, 62 minutes. Four minutes a year, which is the honest scale of the availability argument and a reminder of what this analysis is really for: it is a design tool for the maintenance burden, not an availability lever. The availability case for this vehicle is dominated by what happens before the technician arrives, not by what happens afterwards.