

A fleet of 36 medium transport aircraft, 600 flight hours each per year, two environmental control system packs per aircraft, three main operating bases and one depot. That gives 21,600 flight hours and 43,200 pack operating hours a year. Every value here is an illustrative teaching figure.
The system has seven line-replaceable items and three scheduled tasks. What follows is one corrective task analysed in full, then the roll-up across all of them.
One task, step by step
Replace the flow control valve at the flight line. The task exists because the FMECA carries a valve failure mode that the crew sees as a pack temperature fault, and because the testability model says the built-in test isolates it to this valve without ambiguity.
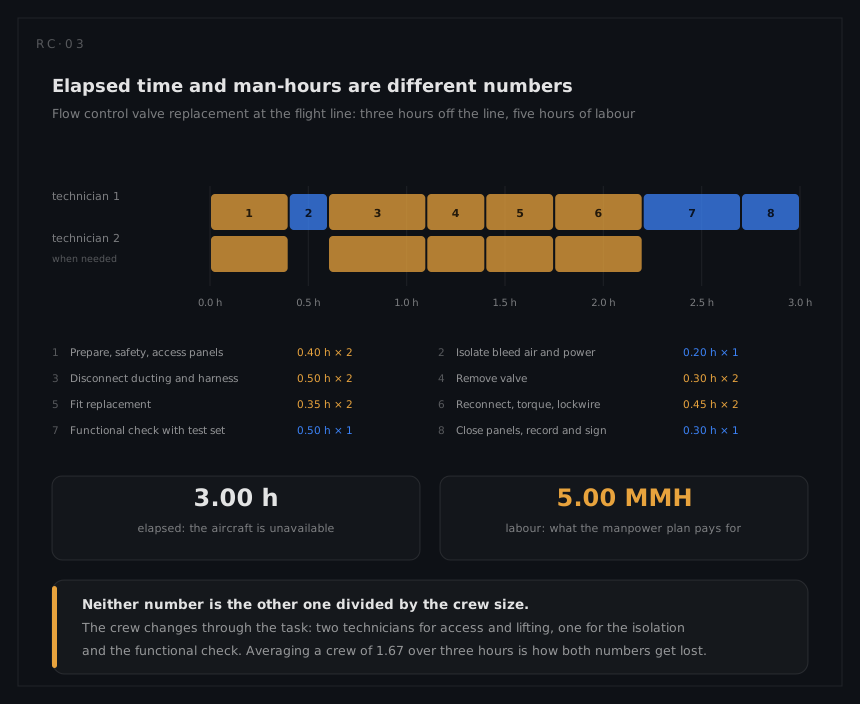
| # | Step | Elapsed | Crew | MMH |
|---|---|---|---|---|
| 1 | Prepare, safety precautions, open two access panels | 0.40 h | 2 | 0.80 |
| 2 | Isolate bleed air and electrical power | 0.20 h | 1 | 0.20 |
| 3 | Disconnect ducting and harness | 0.50 h | 2 | 1.00 |
| 4 | Remove valve | 0.30 h | 2 | 0.60 |
| 5 | Fit replacement valve | 0.35 h | 2 | 0.70 |
| 6 | Reconnect, torque and lockwire | 0.45 h | 2 | 0.90 |
| 7 | Functional check with the pack test set | 0.50 h | 1 | 0.50 |
| 8 | Close panels, record and sign | 0.30 h | 1 | 0.30 |
| Total | 3.00 h | mean 1.67 | 5.00 |
Read the shape rather than the total. Getting to the valve and proving the repair is 78 per cent of the elapsed time; removing and fitting the valve itself is 22 per cent. That ratio is the single most useful output of a task analysis, because it says where a design change would pay and where a faster technician would not.
What the task actually needs
The times are the part everybody remembers. The resource list is the part the rest of the programme is built from:
| Resource | This task |
|---|---|
| Personnel | Two technicians, airframe and propulsion trade, one qualified on the pack test set |
| Support equipment | Pack functional test set; torque wrench to 40 Nm; ducting support cradle |
| Special tooling | Gland nut spanner, valve-specific, one per base |
| Spares | One flow control valve |
| Consumables | Two duct seals, four O-rings, lockwire, 0.2 litre of approved lubricant |
| Facilities | Hardstand, ground power, no lifting or clean-room requirement |
| Access | Two panels, one requiring a work stand |
| Hazards | Residual bleed air pressure, hot surfaces for 20 minutes after shutdown |
| Prerequisite | Pack shut down and cooled; no concurrent work on the same bleed system |
Two of those rows have consequences an hour estimate never shows. The gland nut spanner is a special tool nobody would otherwise buy, and the task analysis is where its existence and its quantity, one per base, are first written down. And the prerequisite on concurrent work is what turns three parallel tasks on the same aircraft into two, which is a maintenance planning constraint rather than a maintainability one.
The same failure, three different tasks
A single failure mode generates a different task at each level of the support system, and the analysis covers all of them:
| Level | Task | Elapsed | MMH | Needs |
|---|---|---|---|---|
| Flight line | Remove and replace the valve | 3.00 h | 5.00 | Test set, cradle, gland spanner |
| Base workshop | Strip, reseal, reassemble and bench test | 4.2 h | 2.0 | Pneumatic bench, seal kit |
| Depot | Overhaul, replace actuator, certify | 6.0 h | 1.6 | Certified bench, release authority |
Only the first line is what the aircraft experiences. The other two are what the support system has to be able to do, and which of them exists at all is the level of repair analysis question, answered with the times and resources from this table.
Frequency turns a task time into a workload
removals per year = λ × pack hours = 95 × 10⁻⁶ × 43,200 = 4.10 per year
Four times a year, across a fleet of 36 aircraft. On its own that is a modest number; the point is that every task in the system has one, and the sum is the manpower plan.
That is the bare form of the derivation. The data standards build a corrective task frequency from more than the failure rate: the failure mode ratio that says how often the item fails this way, the induced failures that maintenance itself causes, the no-defect removals where the item comes off and turns out to be serviceable, a conversion factor to the unit the frequency is quoted in, and the annual operating requirement. This example uses the failure-mode arrivals alone, which makes every corrective frequency below a floor rather than an estimate. Where the removal record shows no-defect and induced arrivals, they belong in this column and not in a contingency later, because the technician spends the same hours on them.
The roll-up
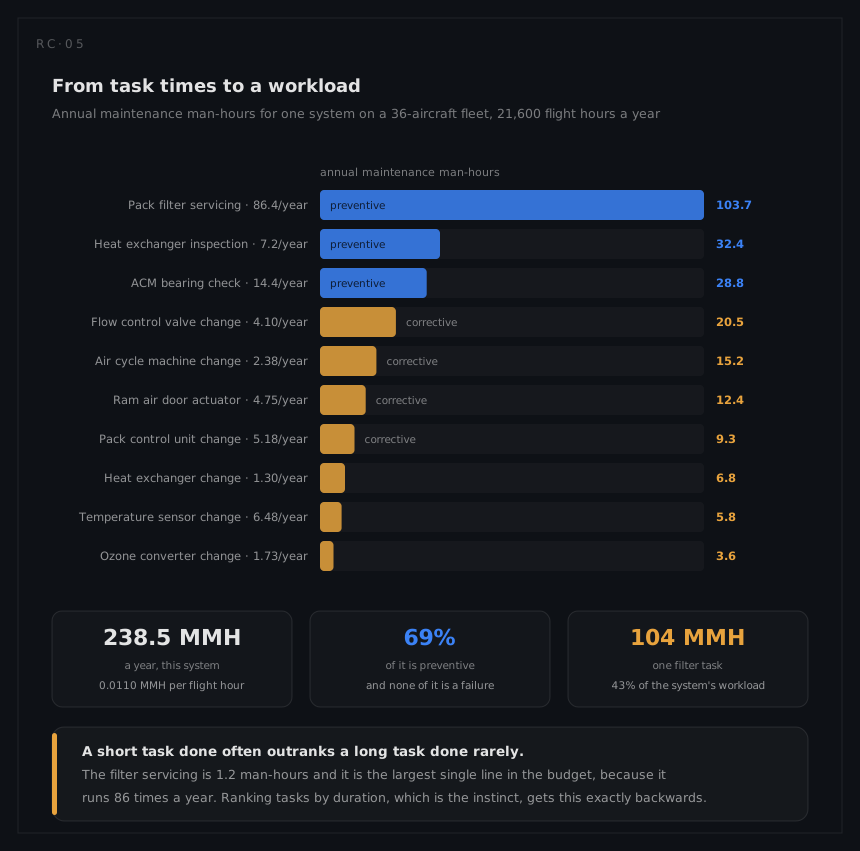
| Task | Frequency | MMH each | MMH per year |
|---|---|---|---|
| Pack filter servicing, every 500 pack hours | 86.4 /year | 1.2 | 103.7 |
| Heat exchanger core inspection, every 3,000 flight hours | 7.2 /year | 4.5 | 32.4 |
| ACM bearing condition check, every 1,500 flight hours | 14.4 /year | 2.0 | 28.8 |
| Flow control valve replacement | 4.10 /year | 5.00 | 20.5 |
| Air cycle machine replacement | 2.38 /year | 6.4 | 15.2 |
| Ram air door actuator replacement | 4.75 /year | 2.6 | 12.4 |
| Pack control unit replacement | 5.18 /year | 1.8 | 9.3 |
| Heat exchanger replacement | 1.30 /year | 5.2 | 6.8 |
| Temperature sensor replacement | 6.48 /year | 0.9 | 5.8 |
| Ozone converter replacement | 1.73 /year | 2.1 | 3.6 |
| 238.5 MMH/year |
The three scheduled tasks are not all on the same clock, and the record has to say which. Filter servicing is written per pack and counted against pack hours (43,200 ÷ 500 = 86.4). The two condition checks are written once per aircraft, cover both packs in the same visit, and are counted against aircraft flight hours (21,600 ÷ 3,000 = 7.2 and 21,600 ÷ 1,500 = 14.4). The corrective frequencies are all λ × 43,200, because every pack carries one of each item and each one fails on its own. Every product in the last column is the printed frequency times the printed man-hours, which is the only way a reader can audit a workload table without the spreadsheet behind it.
238.5 ÷ 21,600 = 0.0110 maintenance man-hours per flight hour for this system, of which 69 per cent is preventive work and none of it is a failure.
That split is the result worth arguing about. It says the manpower this system consumes is decided mostly by the maintenance programme rather than by the reliability of the hardware, and it hands the preventive task logic a specific question: is the 500 pack-hour filter interval earning its 104 man-hours a year?
The other roll-up: aircraft downtime
The corrective tasks again, counted in elapsed hours rather than man-hours. The elapsed column is what the aircraft loses; the man-hour column above is what the manpower plan pays for, and the crew profile is the only thing that connects them:
| Corrective task | Elapsed | Removals per year | Downtime h/year |
|---|---|---|---|
| Flow control valve replacement | 3.00 h | 4.10 | 12.3 |
| Ram air door actuator replacement | 1.7 h | 4.75 | 8.1 |
| Pack control unit replacement | 1.5 h | 5.18 | 7.8 |
| Air cycle machine replacement | 3.2 h | 2.38 | 7.6 |
| Temperature sensor replacement | 0.9 h | 6.48 | 5.8 |
| Heat exchanger replacement | 2.6 h | 1.30 | 3.4 |
| Ozone converter replacement | 1.4 h | 1.73 | 2.4 |
| 47.4 hours/year |
corrective downtime = Σ (removals per year × elapsed) = 47.4 hours a year, fleet wide
which is 1.32 hours per aircraft per year of unavailability from this system's failures. Divide each row's man-hours by its elapsed time and the implied crew never falls below one or rises above two, which is the range the step-level analysis produced; three of the seven sit exactly on an endpoint, because one technician or two works the whole task, and a row implying three technicians would mean one of its two numbers was wrong. That check costs nothing and it is the reason both columns get published rather than one.
That total is active maintenance time only. Waiting for a spare, for a diagnosis or for a hangar slot is logistic and administrative delay, which belongs to the availability model rather than to the task analysis, and which is why an inherent availability computed from this number is not the availability the operator experiences.
Man-hours and downtime rank the tasks differently. The air cycle machine is second among the corrective tasks by man-hours and fourth by downtime, because two technicians work it throughout; the temperature sensor is sixth by man-hours and fifth by downtime, because one technician does all of it. The two rankings support different decisions: the manpower plan reads the first, the availability model reads the second.
What validation changed
The times above are the analysis. Walking the task on the aircraft is what makes them true, and on this example three things moved:
| Finding on the article | Effect |
|---|---|
| The upper access panel needs two people to hold and refit safely | Step 1 crew changed from 1 to 2; elapsed unchanged, MMH up 0.4 |
| The test set connector is unreachable with the cradle fitted | Step order changed; a 0.2 h wait removed |
| The gland spanner did not exist and a substitute damaged two valves | A tool procurement, and a note in the procedure |
The third finding is the one that pays for the validation event on its own. A task analysis that is never walked produces times that are optimistic in a predictable direction, and support equipment lists that are missing exactly the items nobody thought to ask for.
What leaves the analysis
| Output | Goes to |
|---|---|
| The step sequence, with cautions and prerequisites | The technical publication for this task |
| One valve, two seals, four O-rings, lockwire, lubricant | Provisioning, as a demand per task |
| Test set, cradle, gland spanner, one per base | The support equipment list, and its cost |
| Two technicians, one test-set qualified | Training, and the manpower establishment |
| 3.00 h elapsed, 5.00 MMH, 4.10 per year | Maintainability, availability, and the support cost model |
| Workshop and depot task times and resources | Level of repair analysis |