

Analysis does not make hardware reliable; design does. The mathematics of the previous chapters only reveals the consequences of choices made elsewhere: which parts, at what stresses, in what structure, built by what process. This chapter covers the choices themselves, and the programme machinery that forces them to happen on schedule rather than after the field has voted. It is the chapter where reliability stops being a statistic and becomes a management discipline.
The levers of design for reliability
Every reliable product ever shipped got that way through some mix of six levers, and it is worth knowing them as a checklist because each one is owned by a different analysis:
| Lever | What it buys | The analysis that checks it |
|---|---|---|
| Margin and derating | Distance between load and strength distributions; immunity to load scatter | Derating analysis against approved stress limits |
| Simplification | Fewer series parts taxing the product law | Parts-count comparison of candidate architectures (prediction) |
| Part and material selection | Narrower strength scatter, known failure mechanisms, quality provenance | Prediction quality factors; parts programme control |
| Environmental protection | Smaller effective load: cooling, isolation, sealing, transient suppression | Thermal and stress analysis feeding the prediction |
| Redundancy | Mission survival despite item failure, where the first four levers run out | RBD and fault tree modelling with common-cause limits |
| Failure mechanism removal | The wear-out clock slowed or eliminated at its physical source | Physics-of-failure analysis of the dominant mechanisms |
The ordering is deliberate: the cheap levers come first. Margin, simplicity, and part quality cost drawings; redundancy costs hardware forever after. A programme that reaches for redundancy before exhausting derating is usually buying weight to compensate for stress decisions nobody reviewed. The load-strength picture from the foundations chapter is the mental model behind the whole table: every lever either moves a mean, narrows a scatter, or (redundancy) tolerates the overlap it could not remove.
The reliability programme
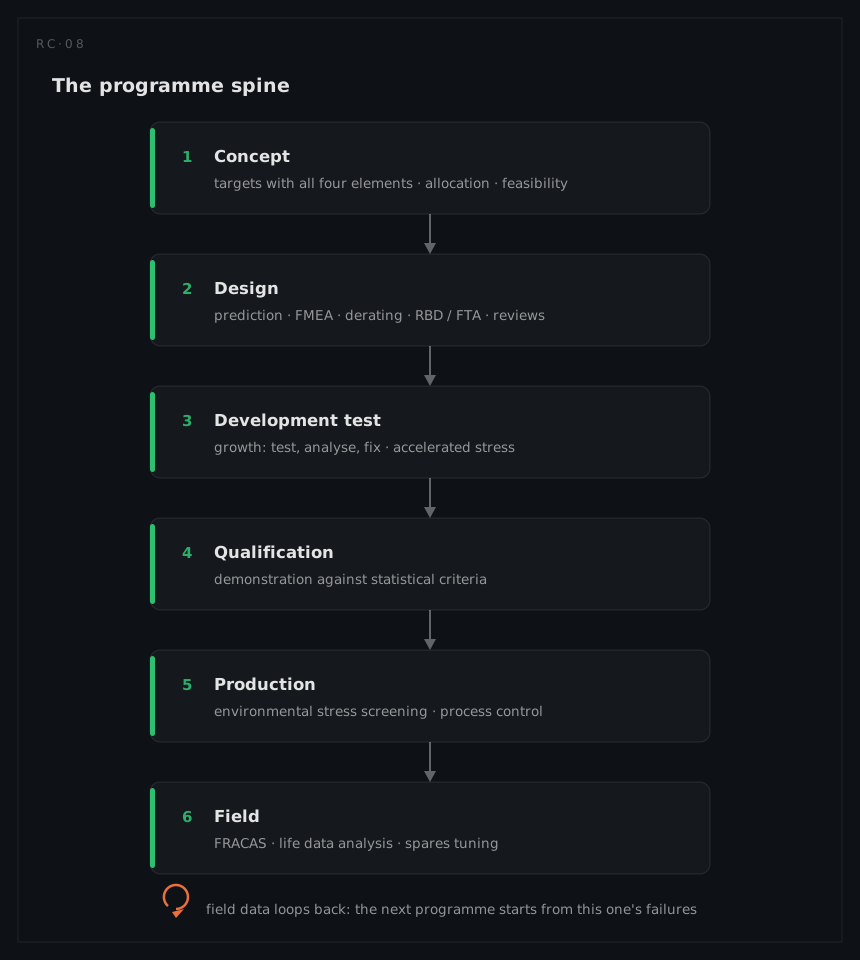
Reliability work only pays when it is phased against the design's freedom to change, which is what reliability programme standards exist to enforce. The pattern they all share:
| Phase | The question | The activities |
|---|---|---|
| Concept | What must this system achieve, and is it feasible? | Requirements with all four definition elements; allocation of the target down the tree; feasibility against comparable systems |
| Design | Will this design meet its budget? | Prediction; FMEA; derating checks; RBD and FTA; design reviews with reliability at the table |
| Development test | Is it actually reliable, and can we make it more so? | Reliability growth testing (test, analyse, fix); accelerated and step-stress testing to find margins |
| Qualification | Can we prove it to the customer? | Reliability demonstration testing against the statistical criteria; qualification of the design's margins |
| Production | Does the factory deliver what the design achieved? | Environmental stress screening; process control; production reliability acceptance |
| Field | What is really happening, and what do we do about it? | FRACAS; life data analysis; spares and maintenance tuning |
The canonical statement of this structure was MIL-STD-785B (15 September 1980), which organised the discipline into numbered tasks that still shape reliability statements of work: programme surveillance tasks in the 100 series (Task 104 is the FRACAS requirement), design analysis tasks in the 200 series (201 modelling, 202 allocations, 203 predictions, 204 FMECA), and test tasks in the 300 series (301 environmental stress screening, 302 development/growth testing, 303 qualification testing). The standard was cancelled in July 1998 without a government successor, part of the broader acquisition reform of that decade, and its role passed to industry standards: IEEE 1332 and SAE JA1000 in the immediate aftermath, and later GEIA-STD-0009 (now SAE GEIA-STD-0009A, Reliability Program Standard for Systems Design, Development, and Manufacturing), which restated the discipline around four outcome-based objectives rather than a task menu: understand the requirements, design for them, produce to them, and monitor and assess in service. On the international side, IEC 60300-1 frames the same activities as dependability management within a broader management-system structure. The lesson a practitioner should take from the standards history: the task names are stable even when the documents churn, and a programme that runs the table above is compliant in spirit with all of them.
Test, grow, demonstrate
Testing serves two different masters, and confusing them wastes both money and evidence. Growth testing exists to find and remove design weaknesses: run the hardware under realistic or accelerated stress, let it fail, analyse every failure to root cause, fix the design, and continue. Tracked over cumulative test time, the fleet's failure intensity falls in the characteristic pattern first reported by Duane in 1964 (cumulative MTBF against cumulative hours plots straight on log-log axes) and formalised statistically in the Crow/AMSAA model, which treats the improving intensity as a non-homogeneous Poisson process and adds confidence bounds and projections; MIL-HDBK-189C is the standard treatment. The management content is the loop, not the curve: growth happens at exactly the rate the programme funds root-cause analysis and implements fixes, and the fitted growth slope is a measurable indicator of how aggressively that loop is running. The full method belongs to reliability growth analysis.
Demonstration testing exists to prove a number to a customer at a stated confidence, using the chi-square and success-run arithmetic from the foundations chapter; MIL-HDBK-781A catalogues the standard test plans and environments. Its economics are unforgiving: high targets at honest confidence levels demand enormous failure-free exposure, which is why mature programmes treat demonstration as the final confirmation of a case built from analysis, growth results, and heritage, never as the primary source of evidence.
Screening is the third, often-confused category: environmental stress screening (temperature cycling, vibration) applied to production units to precipitate latent manufacturing defects before delivery. It demonstrates nothing about design reliability; it protects it, by keeping the factory's infant-mortality escapes from reaching the field. Screens are themselves consumed life, so their severity is a designed trade, tuned by the fallout data they generate.
The loop back from the field
Every phase above feeds forward; the mature part of the discipline is what feeds back. A working FRACAS (failure reporting, analysis, and corrective action system) is the field-phase growth loop: every failure reported, root-caused, and either corrected or consciously accepted, with the closure tracked. Life data analysis turns the accumulating field record into fitted distributions: real βs replacing assumed constants, real characteristic lives calibrating the predictions that were made years earlier on the drawing board. The comparison of predicted against observed is the discipline's honesty check, and the divergences are the curriculum for the next programme's predictions.
This closing of the loop is also where the platform view earns its keep. The analyses in this chapter exchange quantities constantly (allocated budgets down, predicted rates up, mode rates sideways into safety models, field rates back into everything), and in document-driven programmes each exchange is a manual retype with a version-skew risk. RAMSynapse runs the built portion of this loop on one shared system model: Allocation apportions the targets, Prediction computes the rates that flow into RBD and FTA automatically, and Derating checks stresses on the same component records, so the chain from target to evidence stays live as the design changes.