

The theory in this topic is exercised through a toolkit of named analysis methods, each answering one question about the same system. This chapter is the map: what each method is for, when in the lifecycle it runs, how they hand data to one another, and where to go deeper. Most of the methods here have (or will have) their own full RAMS Core book teaching them end to end; this page is the place to see them as one connected practice rather than ten separate documents.
The reliability toolkit
Ten methods carry the reliability workload of a typical programme: allocation, prediction, derating, FMECA, block diagrams, fault trees, importance measures, growth, life data and FRACAS. The first seven are design-side: they run on paper, before hardware exists to fail. The last three are evidence-side: they run on test and field data, and they are what keeps the design-side honest.
| Method | The question it answers | Typical phase | Read more |
|---|---|---|---|
| Reliability Allocation | How does the system target split into budgets each designer can own? | Concept | Full topic published |
| Reliability Prediction | What failure rate does this design's parts, stresses, and environment imply? | Design | Full topic published |
| Derating Analysis | Is every component operating far enough inside its ratings? | Design | Full topic published |
| FMECA | What can each item fail as, what does each mode do to the system, and which modes deserve attention first? | Design | Full topic published |
| Reliability Block Diagram | What system reliability does this architecture deliver, given item rates? | Design | Full topic published |
| Fault Tree Analysis | Which combinations of failures produce this specific unwanted event, and how probable is it? | Design | Full topic published |
| Importance measures | Which components actually drive system risk, and where is improvement worth money? | Design | Computed within FTA and RBD analyses |
| Reliability Growth Analysis | Is test-and-fix actually improving the product, and will it reach the target in time? | Development test | Full topic published |
| Life Data (Weibull) Analysis | What distribution do the observed failures actually follow? | Test and field | Full topic published |
| FRACAS | Is every failure being reported, root-caused, and closed out? | Test and field | Full topic published |
Two entries deserve a note. Importance measures are not a standalone study but the decision layer of the modelling methods: once an RBD or fault tree is quantified, importance rankings (which item's improvement moves the system number most, which minimal cut sets carry the risk) convert the model from a score into an agenda. And FRACAS is less an analysis than an institution: the other nine methods each produce a result, while FRACAS produces the discipline that keeps results connected to reality.
FMEA and FMECA: the inventory and the ranking
One row in that table has to run before several of the others can. FMEA is the inductive analysis: take an item, enumerate the ways it can fail, and follow each mode forward to its local effect, its next-higher effect, and its end effect on the system. It is the only method in the toolkit that produces the failure-mode inventory rather than consuming one. Prediction says an integrated drive generator fails at 250 per 10⁶ flight hours; only the FMEA says that the rate resolves into loss of output, overvoltage, degraded output and a drive mechanical failure, and that those four do four entirely different things to the aircraft. An item rate is a number. A mode inventory is an object the other analyses can be built on.
FMECA is the same worksheet with its criticality half attached. Task 102 offers a qualitative occurrence-level ranking where no rate data exist and, where a prediction is available, a quantitative one: one product per mode per mission phase.
Cm = β · α · λp · t
where α is the mode ratio (the fraction of the item's rate that appears as this mode), β the conditional probability that the mode actually produces the stated severity, λ_p the item failure rate from the prediction, and t the mission time. Item criticality is the sum over that item's modes within one severity class, Cr = Σ Cm, and never across classes, because the terms then do not mean the same thing. Here t is the duration of the applicable mission phase, not the whole mission, wherever the two differ.
The criticality half is the half that gets skipped, and what goes with it is the whole priority order. Three things make it skippable. It needs α and β, which are engineering judgments to be argued in review rather than looked up. It needs λ_p traceable to the item, so the prediction has to exist, be current, and be linked mode by mode instead of pasted. And a worksheet with an empty Cm column still looks like a finished deliverable, which is why it is so often accepted as one. What the programme is then holding is a document that lists everything and prioritises nothing, so the modes get worked in item order or Pareto-sorted by failure rate, and rate order is exactly the order Task 102 exists to overturn.
The aircraft worksheet the example pages share shows the inversion inside a single item. IDG loss of output takes a mode ratio of 0.55 of the generator's 250 per 10⁶ flight hours, so 137.5 per 10⁶, and carries a marginal end effect with a β of 0.001. IDG overvoltage takes a mode ratio of 0.10, so 25.0 per 10⁶, and carries a critical end effect with a β of 0.10. Over the five-hour mission:
Cm(loss of output) = 0.001 × 0.55 × 250 × 10⁻⁶ × 5 = 0.69 × 10⁻⁶ Cm(overvoltage) = 0.10 × 0.10 × 250 × 10⁻⁶ × 5 = 12.50 × 10⁻⁶
The two rankings then point opposite ways. By rate, 137.5 / 25.0 = 5.5: the loss-of-output mode is five and a half times the more frequent. By criticality the order reverses, and the reason is not a ratio between the two Cm values, which sit in different severity classes and cannot be divided. It is that overvoltage carries one fifth the rate and a β a hundred times larger in a higher class, so it plots in the high-criticality corner of the matrix and loss of output does not. A Pareto by rate sends the programme after the generator, which is the one item the architecture already covers with three other sources; Task 102 sends it after the overvoltage path, where a low-rate mode damages equipment that no amount of redundancy restores.
The finding the worksheet produces on reliability's own account, before any other property reads it, is the single-point failure list. A mode whose end effect is loss of the system with no second failure required is an order-one cut set found inductively, before a tree exists to find it deductively, and found early enough that the answer can still be a design change instead of a waiver.
The artefact other analyses read
The FMECA is the one document three other analyses read a column out of, which is the strongest practical argument for finishing it. Each takes a different column of the same worksheet and builds on it:
- Safety works the severity column from both ends. The functional hazard assessment supplies the consequence judgment the severity column is derived from, and where the two use different scales, the civil five-class scheme against MIL-STD-1629A's four, the mapping is recorded once and applied consistently rather than re-argued row by row. The ranked worksheet then hands back the modes the hazard argument has to account for.
- Testability takes the mode list as the rows of its dependency matrix. Each mode is a row carrying its rate, each monitor a column, and the fault detection rate (FDR) and fault isolation rate (FIR) are rate-weighted sums over the result, so the coverage figures inherit the inventory's completeness exactly. A mode missing from the FMEA does not show up as a coverage gap; it is invisible.
- Fault tree analysis takes its basic events from the mode list. They are the modes whose end effects contribute to the chosen top event, drawn from the worksheet: on the aircraft, the class III channel-loss modes that must coincide plus the class I APU and ram air turbine modes. The tree is built from the worksheet rather than from memory, and the reconciliation runs both ways: no class I mode may be absent from the tree, and no basic event may lack a worksheet row with a rate behind it.
Both directions are worked end to end on one shared seventeen-mode worksheet in the industry examples. The safety defence and aerospace page runs Task 101 and Task 102 together on a transport aircraft AC power system, ranks the seventeen modes by criticality, and builds the catastrophic-loss fault tree from the modes the ranking produces. The testability defence and aerospace page reads the same seventeen modes and the same per-item rates, multiplying by installed quantity to reach 1,095 per 10⁶ flight hours, and computes its coverage from that one inventory rather than from a second list. Two properties, one inventory, and no second opinion about what the system can fail as. That is what the shared worksheet buys, and it is why the FMECA's revision state is a programme-level configuration item rather than a document-control detail.
How the methods chain together
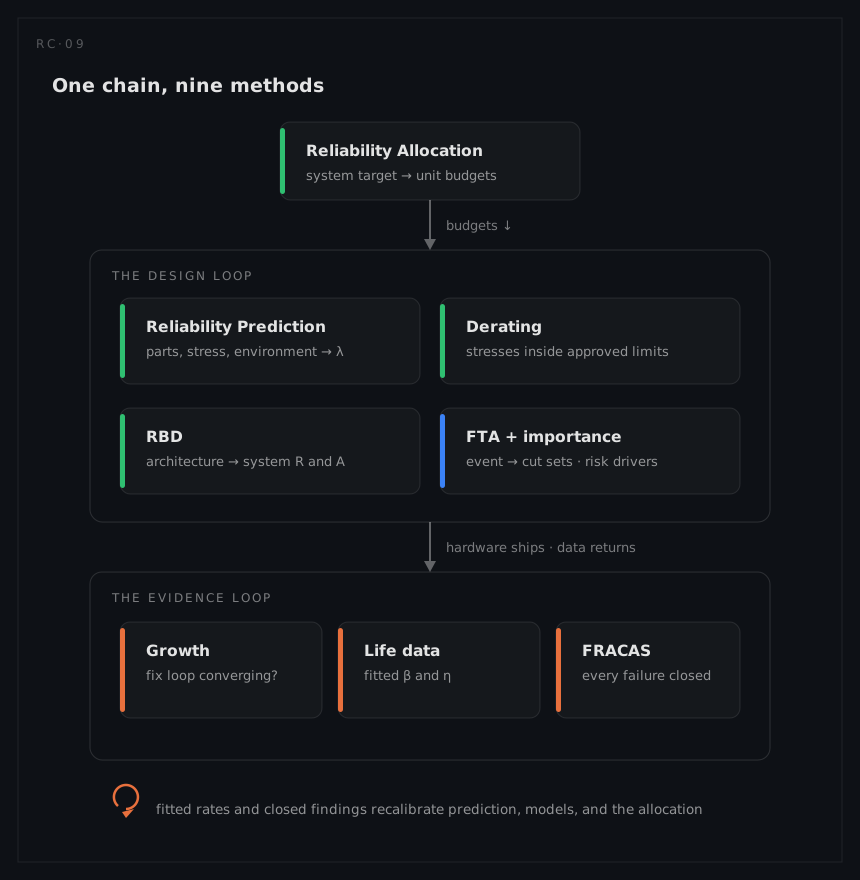
The methods are usually taught separately and practised as a chain, and the chain is easiest to see as quantities in motion:
- Targets flow down. The system requirement enters allocation, which apportions it into subsystem and unit budgets. Those budgets are the acceptance criteria every later analysis reports against.
- Rates flow up. Prediction turns the parts list, stresses, and environment into item failure rates; RBD and FTA combine them through the system structure into mission reliability, availability, and top-event probabilities that can be compared with the allocated targets.
- Modes split the rates. FMECA divides each item's predicted rate by mode ratio into the ways that item actually fails, attaches an end effect and a severity to each, and ranks the result by criticality. Nothing downstream can address a failure it cannot name. The fault tree in particular does not take an item rate as a basic event; it takes a mode's rate, which is the mode ratio times the item's, and a tree quantified on whole-item rates counts failures that could not have caused its top event. Every row of a testability dependency matrix is a mode for the same reason.
- Margins guard the rates. Derating verifies the stress assumptions the prediction relies on; a component outside its derating limits is a prediction line item that is quietly wrong.
- Rankings steer the iteration. Importance measures on the quantified models point to the components and cut sets where redesign, redundancy, or better parts buy the most system reliability per unit of effort.
- Evidence recalibrates everything. Growth analysis tracks whether test-and-fix is converging on the target; life data analysis replaces assumed distributions with fitted ones; FRACAS feeds the field record back into predictions, models, and the next allocation.
The chain is also the reason data management is a first-order reliability problem. Every arrow above is a handoff, and in document-driven programmes each handoff is a spreadsheet export, a retype, and a version-skew risk; audits of such programmes routinely find system models running on rates two revisions stale. Whatever toolset a programme uses, the arrows deserve as much engineering attention as the boxes.
Where RAMSynapse runs them
The built modules of the RAMSynapse platform cover the design-side chain on one shared system model, so the handoffs above are live links rather than exports: Reliability Allocation apportions targets down the product structure, Reliability Prediction computes part-stress and parts-count rates that flow directly into the Reliability Block Diagram and Fault Tree modules, Derating checks component stresses against approved profiles on the same records, FMECA builds the mode inventory on that same product structure with the item rates arriving from the prediction and the mode rates publishing onward to the fault tree and Testability modules, and the fault tree module computes cut sets and importance measures on the shared rates. The live module ring on the home page shows this data flow as it exists in the product.
Industry lenses
The toolkit is universal; the emphasis is not. Which methods dominate, which standards govern them, and what the deliverable is called varies by sector, and the industry pages describe how RAMSynapse is applied in each:
| Industry | What reliability work typically looks like |
|---|---|
| Defence and aerospace | Contractual reliability programmes in the MIL-STD-785 lineage: allocation, prediction, FMECA, and demonstration as deliverable data items |
| Space systems | One-shot and long-dormancy reliability, severe mass penalties on redundancy, heavy reliance on parts control and analysis over test |
| Railway | RAMS as a lifecycle discipline under the EN 50126 framework, with reliability targets tied to service availability commitments |
| Automotive | High-volume statistics: B-life requirements, warranty-driven life data analysis, and functional-safety interfaces per ISO 26262 |
| Energy and resources | Availability economics: reliability feeding maintenance strategy and production-loss models for long-life plant |
| Medical devices | Reliability evidence inside a regulated risk-management frame, with use-related and one-shot device statistics |
| Electronics and high tech | FIT-level component prediction, accelerated testing, and screening economics at consumer volumes |
| Nuclear | Redundancy and common-cause defence analysed to regulatory depth, with probabilistic risk assessment as the umbrella |
Read the toolkit table's methods through any one of these lenses and the same pattern holds: the mathematics of this topic is identical everywhere; what changes is which failure consequences the industry prices highest, and therefore which analyses its contracts demand.