

A prediction answers a question about parts: how often does this hardware fail. It cannot answer the question a programme is actually asked, which is about a mission: will the system still be doing its job in 720 hours. Between the two sits an assumption that the prediction makes silently and almost always wrongly, that every failure counts. A reliability block diagram is where that assumption gets replaced by an explicit one.
An RBD is a success-oriented logic model. Each block is an item that either works or does not; the blocks are connected so that an unbroken path from the input node to the output node means the system is doing its job. Nothing in the drawing is geometry. The blocks are not where the parts are, the lines are not cables or pipes, and the order left to right carries no time. The only thing the diagram encodes is which combinations of working items constitute success. What it computes from that is the probability the system is working: at the end of a stated mission if the blocks carry failure rates, and at any moment in steady state if they carry repair times as well.
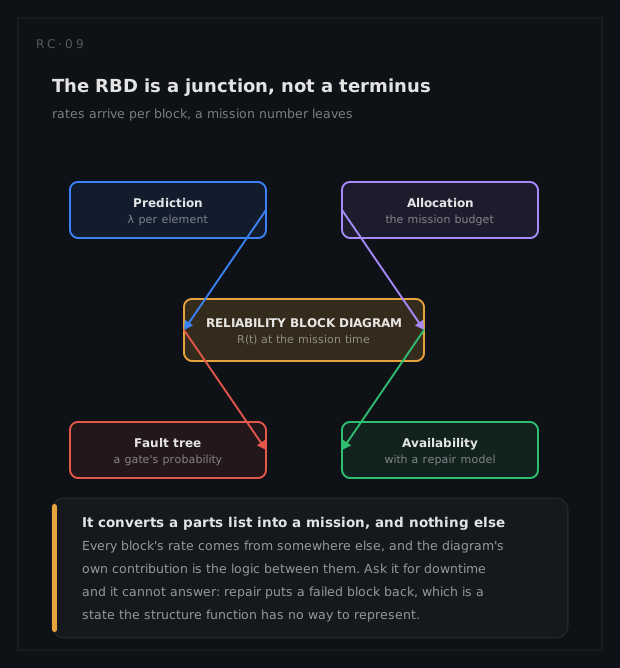
That is a narrow job, and the narrowness is the point. Everything the model needs beyond its own logic (the rate on each block, the mission time, the target it is judged against) arrives from somewhere else, which is why the RBD is the most connected artefact in a reliability programme and the least self-sufficient.
What it is and why it exists
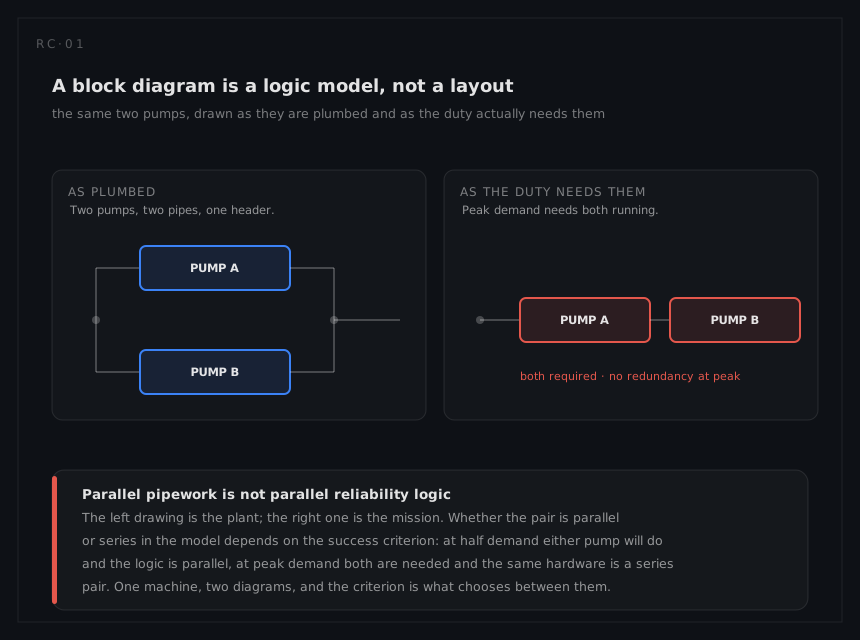
The technique is old enough to have been standardised twice. MIL-STD-756B, Reliability Modeling and Prediction, made the reliability model a formal deliverable in 1981 and drew the distinction the discipline still runs on: a basic-reliability model in which every item sits in series, used for sizing spares and maintenance, and a mission-reliability model in which redundancy appears, used for the success case. IEC 61078 carries the international definition, sets out the boolean evaluation of the structure, and is explicit about what the technique assumes: blocks that fail independently, a stated mission, and a success criterion fixed before anything is drawn.
The mathematics behind it is older still and belongs to the theory of coherent structures. Every RBD is one, and every coherent structure has two equivalent descriptions: its minimal path sets, the smallest groups of items whose survival is sufficient, and its minimal cut sets, the smallest groups whose failure is sufficient to stop it. The cut-set view is the same object a fault tree computes from the other side, which is why the two techniques answer the same question and read so differently: an RBD draws what has to work, a fault tree draws what has to fail.
| Lineage | What it contributed |
|---|---|
| Coherent-structure theory (1960s) | Path sets, cut sets, and the bounds that make large structures computable |
| MIL-STD-756B (1981) | The reliability model as a deliverable; basic against mission reliability |
| NUREG-0492 (1981) | The cut-set machinery, from the fault-tree side of the same duality |
| IEC 61078 | The international definition, the boolean evaluation, and the independence conditions |
Why the activity exists at all: because redundancy is invisible to arithmetic that only adds. Add up the eleven blocks of the worked example and the answer is 521 failures per 10⁶ hours, an MTBF of 1,919 hours and a 720-hour mission that succeeds 69 times in a hundred. Draw the same eleven blocks as the plant is actually built and the mission succeeds 98 times in a hundred. Neither number is wrong. They answer different questions, and only the diagram distinguishes them.
Where it sits in the programme
The diagram arrives once the architecture is stable enough to have a success criterion and stays for the life of the programme. At concept stage it is drawn from the candidate architecture and fed with generic rates, and its job is comparative: does the second dryer earn its place, does the vote need three transmitters or two. As the prediction matures the blocks inherit real rates, and the model turns from an architecture argument into evidence. In service it is re-run whenever field data moves a rate.
| Programme stage | What the diagram is for |
|---|---|
| Concept | Comparing architectures before any of them exists; ranking redundancy options by what they buy |
| Preliminary design | Turning the first prediction into a mission number and testing it against the allocated mission budget |
| Detailed design | Cut-set and importance ranking: which single item to remove, which pair to separate |
| In service | Re-running with field rates; the structure rarely changes, the numbers always do |
Its neighbours are worth naming precisely, because the RBD is often asked to do their work. Allocation hands it a target and reads back whether the architecture can meet it, the mission budget being the line that redundancy is allowed to reduce. A fault tree computes the same cut sets from the failure side and is the better tool once the logic stops being a two-terminal network. Availability is the same structure with a restoration time on every block, which the module computes; what it cannot carry is repair dependency, a shared crew or a queue for a spare, and that is the boundary where a Markov model or a simulation takes over. And FMECA supplies the thing the diagram most often gets wrong: which failure mode of a block actually defeats the path it sits on.