

An RBD is quick to draw and easy to draw wrongly, and almost every wrong one is wrong before a single rate is entered. The sequence below front-loads the decisions that cannot be corrected later: what counts as success, where the system ends, and which failures the logic is allowed to survive.
1. State the success criterion, in a sentence
The criterion is the model. Everything else is bookkeeping. It is one sentence with three parts, agreed before anything is drawn: what the system must deliver, to what degree, for how long. The worked example uses "dry air above 6 bar at the actuator header, for 720 hours", and each clause changes the diagram: drop dry and the dryers leave the model, drop above 6 bar and one compressor is enough where two were needed, shorten the 720 hours and every redundant group looks better.
| The criterion is silent about | What goes wrong |
|---|---|
| The degree of service (full flow, degraded, minimum safe) | A pair that is parallel at half load and series at full load gets drawn once, at the wrong load |
| The mission length | Redundancy is scored at an unstated time, and every comparison between architectures becomes unfalsifiable |
| Which failures count | The diagram silently becomes a basic-reliability model, and redundancy stops paying |
| The starting state | A degraded start (one unit already out on a deferred defect) is the case the fleet actually flies, and it is a different diagram |
A system with several criteria has several diagrams. That is not duplication, it is the honest answer: dispatch, mission success and safe shutdown are three different questions about one machine, and one drawing cannot hold all three.
2. Fix the boundary and the phase
The boundary decides what is a block and what is an assumption. Anything outside it is being assumed perfect, so the boundary list is a list of claims: mains power never fails, the operator always responds, the instrument air the other plant supplies is always there. Write them down; on a mature programme half of them turn out to be blocks.
Phased missions are handled by drawing one diagram per phase and multiplying, with two subtleties that catch people. A block that runs in only one phase accrues rate only in that phase. And a block that carried a phase and is still needed in the next one does not reset: its survival probability is conditional on having already survived what came before.
3. Draw the logic, not the schematic
The most common defective diagram is a redrawn P&ID or a redrawn wiring schematic. The test to apply to every branch is a question about function rather than about connection: if this block alone fails, does the system still meet the criterion? If yes, it is on a parallel path. If no, it is in series, however many pipes it has.
| Physical arrangement | Reliability logic |
|---|---|
| Two pumps on two pipes, both needed at peak demand | Series |
| Two pumps on two pipes, either sufficient at the stated demand | Parallel |
| One cabinet containing two independent supplies | Parallel |
| Three transmitters, any two of which must agree | 2-out-of-3 |
| A cross-tie that only helps if it is open, and it is normally shut | A block, and its own failure rate belongs on it |
Two habits keep the drawing honest. Draw the support services (power, cooling, control air) as blocks the first time they are mentioned rather than the third. And give every block a rate source before moving on, because a block nobody can source is usually a block nobody has defined.
4. Populate the blocks
Rates arrive from the prediction, from FMECA at mode level, from life data, or from a vendor. Whichever the source, three declarations travel with the number and must match across the whole diagram: the unit (per 10⁶ hours, FIT, per demand), the clock (operating hours, calendar hours, cycles), and the mission time the block is exposed to, which is not the same for every block in a phased or partly duty-cycled system.
One conversion deserves care. A block whose failure is dormant, a standby unit or a protection channel, does not carry a rate over the mission in the same sense as a running one: its contribution is a probability of failure on demand, built from its dangerous-undetected rate and the interval since it was last proved. Putting a running rate on a dormant block is one of the few errors that makes a diagram optimistic by an order of magnitude.
Where the diagram is going to be evaluated for availability, each block needs a restoration time as well, and it needs the same treatment. The number arrives from a maintainability prediction, from FRACAS records of what restorations actually took, or from a vendor's quoted task time, and it carries two declarations of its own: which clock it is measured on, and what is inside it. A repair time is hands-on time with the spare already at the machine; a mean down time also contains the wait for the part, the permit and the technician. Those two answers differ by a factor of 5.4 in the worked example, so a diagram that mixes them across its blocks is computing nothing at all.
5. Choose the evaluation
| The structure is | Evaluate by |
|---|---|
| Nested series and parallel groups | Collapsing block by block; every tool does this and so can a pencil |
| A voted group | The k-out-of-n binomial on the branch reliability |
| A standby group | The Poisson form, with the switch or start probability in it explicitly |
| A bridge or anything with a cross-connection | Conditioning on the cross element, or enumeration |
| Large, and only a bound is needed | The minimal-cut lower bound, which is tight for systems that mostly work |
| Availability rather than mission reliability | The same collapse, with each block's 1/(1 + λ·MTTR) in place of its e^(−λt) |
| Repairs that queue, share a crew or wait for an outage | Discrete-event simulation, or a Markov model of the coupled group |
6. Deal with what the blocks share
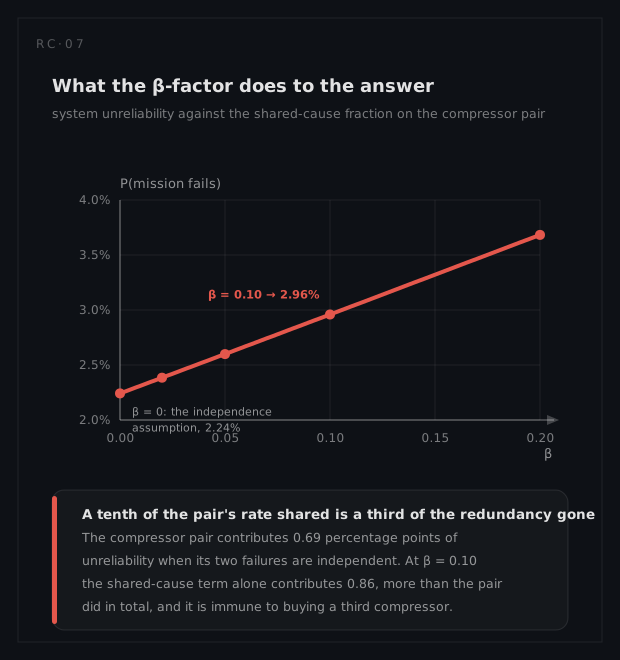
This is the step that separates a diagram that informs a decision from one that flatters it. Redundancy in a model is worth exactly as much as the independence behind it, and independence is an engineering claim about separation, not a mathematical convenience.
Apply the β-factor to every redundant group: a fraction β of each unit's rate is attributed to causes that take the group as a whole, and that shared portion is drawn as a block in series with the group. Then argue the value of β from the separation that actually exists.
| Separation that exists | What it does to β |
|---|---|
| Same design, same batch, same calibration, same room | β at the pessimistic end; the pair is close to a single item for shared causes |
| Different manufacturer or different technology | Design and manufacturing causes largely removed |
| Different location, different power source, different maintainer | Environmental and human causes largely removed |
| Staggered maintenance, so the pair is never opened on the same day | Removes the single most common human shared cause |
Sensitivity beats precision here. Run the model at β = 0, 0.05 and 0.1 and report all three: if the decision changes between them, the number that needs work is β and not the block rates.
Two other shared-dependence cases have no β treatment. A support service is a real block and must be drawn. Load sharing, where the survivor works harder after the first failure, breaks the constant-rate assumption itself, and the group belongs in a state model.
7. Evaluate, and read the answer at the mission
The output is R(t) at the stated mission time. Two derived numbers are usually wanted with it, and both need a caveat attached:
- The equivalent failure rate,
λeq = −ln R(t) / t, which is the constant rate a series item would need to give the same result. It is a presentation device. It is valid at exactly the t it was computed at, and for a redundant system it changes with t. - The mean time to failure,
∫R(t)dt, which for a redundant structure is dominated by behaviour long after any mission of interest and can rank architectures in the opposite order to the mission result. - The availability, where the blocks carry restoration times. Quote which one: inherent availability uses repair time alone, operational availability adds the logistic and administrative delay, and the two differ by more than most design changes do.
When to simulate instead
Nothing new has to be drawn. The same diagram is the simulation: each replication draws a life for every block, marks the ones that die inside the mission, and asks the structure function whether a path survives. Sampling earns its cost in exactly the cases the boolean model excludes: a block that is not constant-rate, repairs that queue for one crew or one spare, a standby whose ageing depends on how long it waited, phased missions with carry-over, and any question about the distribution of an outcome rather than its mean.
It costs sampling error in return, and that error is computable before the run rather than discovered during it: for a probability, n = (z/ε)² · R(1 − R), and for a mean, n = (z·CV/ε)². Where both methods apply, run both. The worked example evaluates one diagram twice and gets 0.977010 by simulation against 0.977585 by algebra, 575 parts per million apart, and that agreement is what licenses the simulation to be trusted where no closed form exists.
8. Rank what matters, not what fails most
An evaluated diagram gives a number; a ranked one gives a decision. Three rankings, answering three different questions:
| Ranking | The question it answers |
|---|---|
| Cut sets by order, then by probability | Which combinations actually carry the risk; an order-1 cut is a single point of failure whatever its rate |
Birnbaum importance, ∂Rsys/∂Rᵢ | How much the system's reliability moves per unit of improvement in this block: where design effort pays |
Criticality importance, IB · qᵢ / (1 − Rsys) | Given that the system failed, how likely this block was responsible: where inspection and spares pay |
The two importance measures disagree routinely and are both right. A single, very reliable block in series can have the highest Birnbaum importance in the model and a low criticality, because the system depends on it utterly and it almost never fails.
9. Test against the budget, then iterate
The diagram's result is compared with the mission budget the allocation set for this system, and the comparison has only four honest outcomes: it passes and the margin is recorded; it fails and the structure changes (a path added, a cut set broken, a shared cause separated); it fails and a block's rate must improve, which flows back to the design as a requirement; or it fails and the target is renegotiated on evidence. Redrawing the diagram until it passes is not on the list.
Then keep it alive. The structure is stable, the rates are not: a prediction re-run, a field failure, a change of supplier or a deferred-defect policy that lets the system dispatch with one path already down all move the answer, and the last of those changes the starting state the whole model assumed.