

Consider the instrument-air supply of a water treatment works: the compressors, dryers, receiver and header that keep every pneumatically actuated valve on the site able to move. It is deliberately neither the gas compressor train the industry examples carry nor the interlocking controller the allocation module budgets, and its numbers belong to neither. Every value below is an illustrative teaching figure; the arithmetic is the method's.
The success criterion, agreed before anything was drawn: dry air above 6 bar at the actuator header, continuously, for the 720 hours between planned maintenance windows. The site cannot run on half pressure and cannot run on wet air, and 720 hours is the interval at which everything is inspected anyway.
The blocks
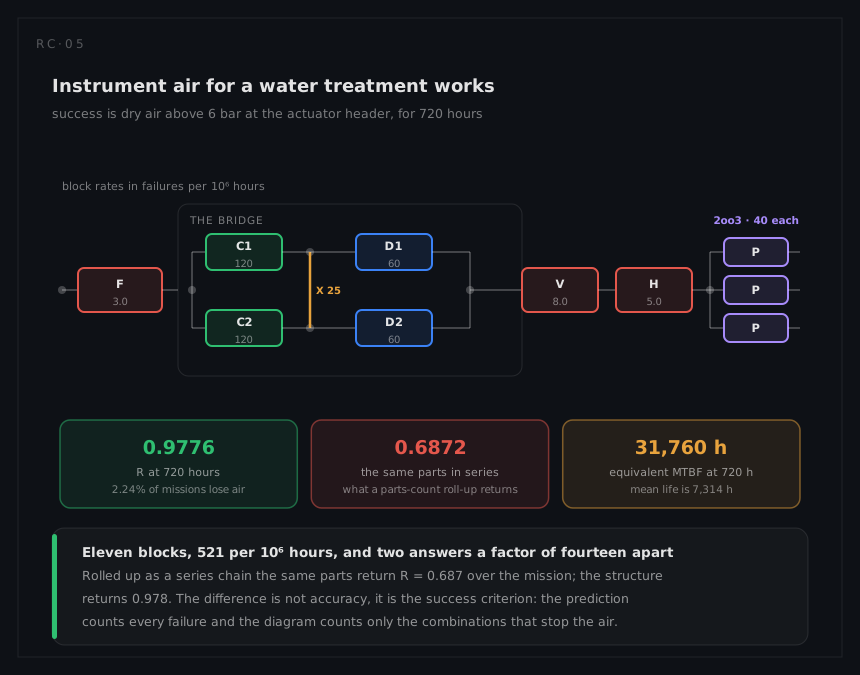
| Block | λ per 10⁶ h | R(720) | Position in the logic |
|---|---|---|---|
| F · Intake filter and inlet | 3.0 | 0.997842 | Series, alone |
| C₁, C₂ · Screw compressors | 120 each | 0.917227 | Left side of the bridge |
| X · Cross-tie between the trains | 25 | 0.982161 | The bridge element |
| D₁, D₂ · Desiccant dryers | 60 each | 0.957720 | Right side of the bridge |
| V · Air receiver | 8.0 | 0.994257 | Series, alone |
| H · Header and isolation | 5.0 | 0.996406 | Series, alone |
| P₁, P₂, P₃ · Pressure transmitters | 40 each | 0.971611 | 2-out-of-3 vote |
The plant is built as two independent compressor-and-dryer trains with a cross-tie between them, which is exactly a bridge: C₁ can feed D₂ and C₂ can feed D₁, but only through X. The transmitters are voted 2-out-of-3, so the control loop survives one of them failing.
The bridge, three ways
Conditioning on the cross-tie splits the structure into two that collapse. With X healthy the compressors are a parallel pair in series with a parallel pair of dryers:
R(X works) = [1 − (1 − 0.917227)²] × [1 − (1 − 0.957720)²] = 0.993149 × 0.998212 = 0.991373
With X failed the two trains are independent paths:
R(X failed) = 1 − (1 − 0.917227 × 0.957720)² = 1 − 0.121554² = 0.985225
Rbridge = 0.982161 × 0.991373 + 0.017839 × 0.985225 = 0.991264
Enumerating all 32 states of the five elements returns the same 0.991264, and the minimal-cut bound returns 0.991250, fourteen parts per million low. The minimal-path bound returns 0.999722, which is not an answer to anything.
What the cross-tie is worth is visible in those two conditional lines. Without it the bridge would be 0.985225; with a perfect one it would be 0.991373. The real tie, at 25 per 10⁶ hours, delivers 0.991264: it buys 0.604 percentage points of reliability and its own unreliability gives back 0.011 of them. A cheap element in the right place is worth more than an expensive one in the wrong place, and this is the arithmetic that says so.
The vote and the system
The 2-out-of-3 transmitter group, from the binomial with R = 0.971611:
Rvote = 3R² − 2R³ = 2.832082 − 1.834455 = 0.997628
The five groups are in series, so they multiply:
Rsys(720) = 0.997842 × 0.991264 × 0.994257 × 0.996406 × 0.997628 = 0.977585
Two point two four per cent of maintenance intervals lose instrument air. For comparison, the same eleven blocks summed as a series chain, which is what a parts-count prediction returns, come to 521 per 10⁶ hours: an MTBF of 1,919 hours and R(720) = 0.687. The structure is worth a factor of fourteen on the shortfall, and the difference is entirely the success criterion.
Where the 2.24 per cent goes
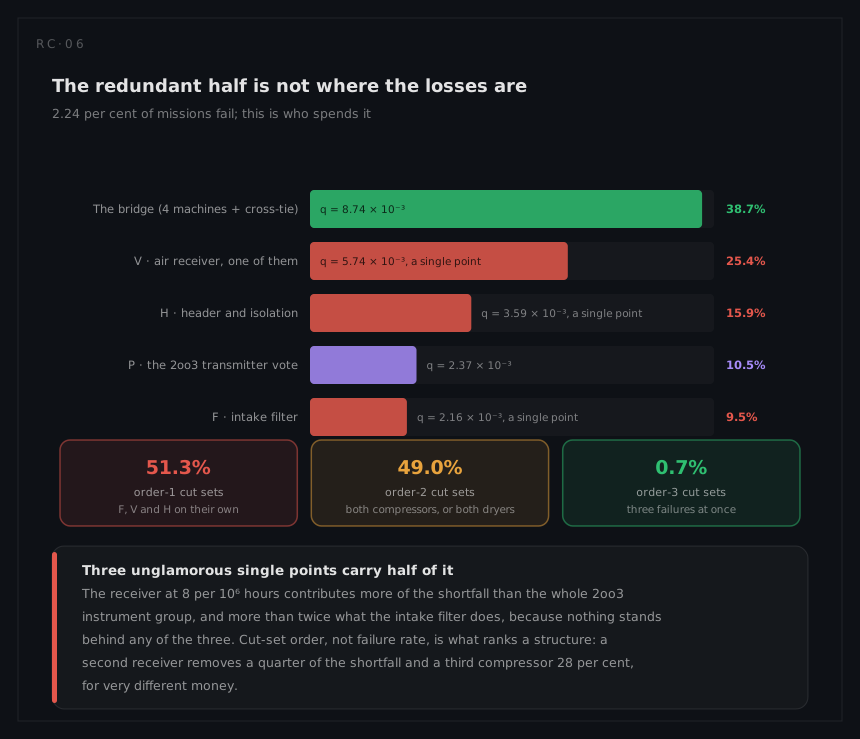
| Group | Its unreliability | Share of the summed contributions |
|---|---|---|
| The bridge: 4 machines and a cross-tie | 8.74 × 10⁻³ | 38.7% |
| V · air receiver | 5.74 × 10⁻³ | 25.4% |
| H · header and isolation | 3.59 × 10⁻³ | 15.9% |
| P · the 2oo3 vote | 2.37 × 10⁻³ | 10.5% |
| F · intake filter | 2.16 × 10⁻³ | 9.5% |
Read by cut-set order the same result is starker. Summed as though the cuts were disjoint they give 0.022676 against the exact 0.022415, the 1.2 per cent difference being the overlap the rare-event approximation ignores. Of that sum the three order-1 cuts, the filter, the receiver and the header on their own, carry 50.7 per cent between them. The order-2 cuts (both compressors, both dryers, or two of the three transmitters) carry 48.8 per cent, and everything requiring three simultaneous failures carries 0.6.
The design conversation follows directly, and it is not the one the plant expected:
| Change | R(720) | Shortfall removed |
|---|---|---|
| As built | 0.977585 | 0% |
| A second air receiver | 0.983200 | 25% |
| A third compressor on the duty side | 0.983817 | 28% |
| A second receiver and a duplicated header | 0.986733 | 41% |
| Halving the rate of every block in the plant | 0.991408 | 62% |
A pressure vessel with no moving parts buys almost exactly what a third screw compressor buys, for a small fraction of the money, because the vessel is an order-1 cut and the compressor is already the third element of an order-2 one. This is the whole argument for drawing the diagram before choosing what to buy.
Would a standby have been better than a running pair?
The compressor function taken on its own, at 120 per 10⁶ hours a unit and the same 720-hour mission:
| Arrangement | R(720) | MTTF |
|---|---|---|
| One compressor | 0.917227 | 8,333 h |
| Two running in parallel | 0.993149 | 12,500 h |
| One duty, one cold spare, perfect start | 0.996476 | 16,667 h |
| One duty, one cold spare, 95 per cent start | 0.992513 | 16,250 h |
The last two rows are the lesson. A cold spare that starts 95 times in a hundred has the longer mean life of the two real options, 16,250 hours against 12,500, and the worse mission reliability, 0.9925 against 0.9931. Setting the two expressions equal puts the break-even start probability at 0.958: below that the running pair wins the mission, above it the spare does, and the mean life says the opposite throughout. Which number the plant should optimise is settled by the criterion in the first paragraph, not by the tables.
Availability, once every block carries a repair time
The mission result says nothing about downtime, and downtime is what the works manager asks about. Put a mean repair time on each block and the same structure answers that question too, with no change to the logic at all.
| Block | λ per 10⁶ h | MTTR | U = λ·MTTR / (1 + λ·MTTR) |
|---|---|---|---|
| F · intake filter | 3.0 | 2 h | 6.0 × 10⁻⁶ |
| C₁, C₂ · compressors | 120 | 8 h | 9.6 × 10⁻⁴ each |
| X · cross-tie | 25 | 4 h | 1.0 × 10⁻⁴ |
| D₁, D₂ · dryers | 60 | 6 h | 3.6 × 10⁻⁴ each |
| V · air receiver | 8.0 | 12 h | 9.6 × 10⁻⁵ |
| H · header | 5.0 | 4 h | 2.0 × 10⁻⁵ |
| P₁, P₂, P₃ · transmitters | 40 | 1.5 h | 6.0 × 10⁻⁵ each |
The bridge is its cut sets multiplied, exactly as for reliability, but now each factor is the chance a block is down at a given moment rather than the chance it fails during a mission:
Ubridge = UC² + UD² + 2·UC·UX·UD = 9.22 × 10⁻⁷ + 1.30 × 10⁻⁷ + 6.9 × 10⁻¹¹ = 1.05 × 10⁻⁶
The vote contributes 3·UP² = 1.08 × 10⁻⁸, and the three series blocks contribute themselves:
Usys = 6.0 × 10⁻⁶ + 1.05 × 10⁻⁶ + 9.6 × 10⁻⁵ + 2.0 × 10⁻⁵ + 1.08 × 10⁻⁸ = 1.23 × 10⁻⁴
A = 0.999877, which is 65 minutes of lost air a year.
The ranking has changed, and that is the point of computing it. The air receiver was a quarter of the mission shortfall; it is 78 per cent of the downtime, because its twelve-hour repair is the longest on the plant. The bridge was 38.7 per cent of the shortfall and is 0.9 per cent of the downtime: the second compressor no longer has to outlast a 720-hour mission, only the eight hours its partner spends being fixed, and that is a far easier thing to ask of it.
The number the operator actually experiences
None of the above includes waiting for a part, a permit, or a contractor. Add a mean logistic delay of 24 hours and an administrative delay of eight to every restoration:
| Inherent | Operational | |
|---|---|---|
| Mean down time per event | MTTR | MTTR + 24 + 8 |
| System availability | 0.999877 | 0.999333 |
| Downtime a year | 65 minutes | 5.8 hours |
A factor of 5.4, from the same hardware and the same diagram. The supply chain is worth more here than any redundancy on the drawing, and the RBD is what makes that comparable: the structure, the cut sets and the importance ranking are identical, and only the number on each block moved.
The same diagram, evaluated by simulation
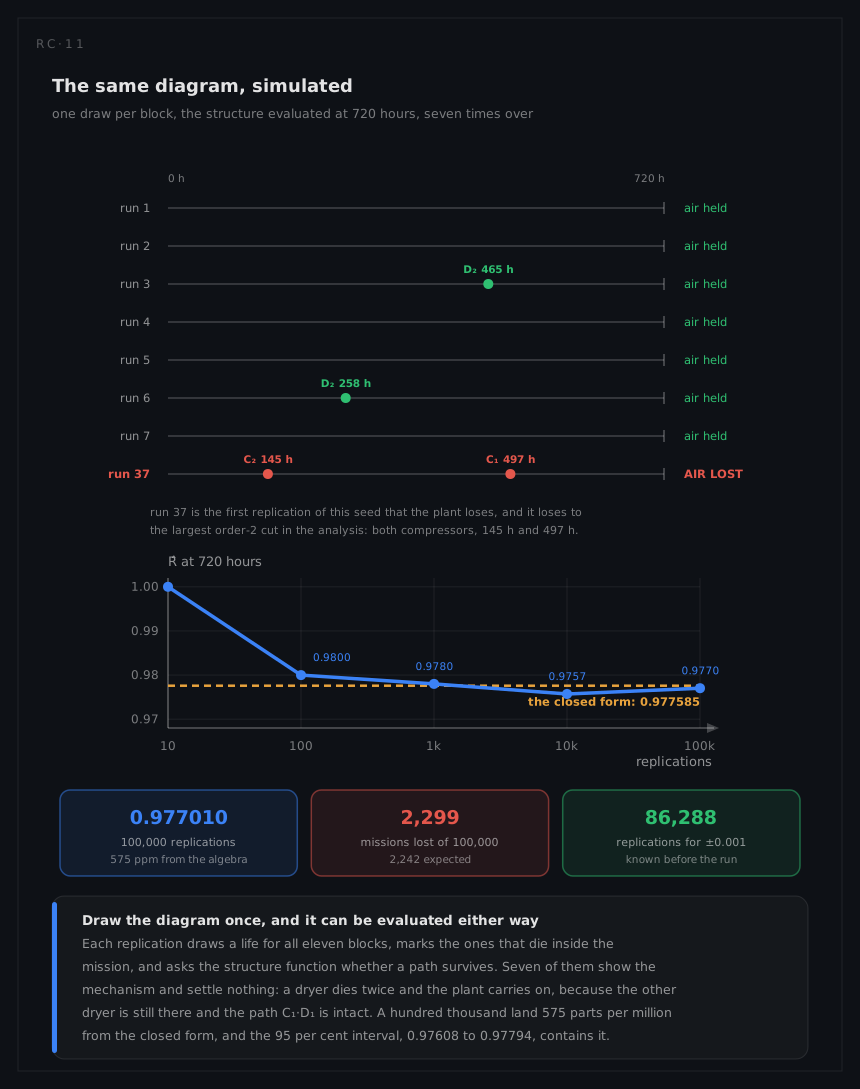
Everything above was algebra. The same diagram can be evaluated a second way, by sampling, and the two are worth putting side by side: the algebra is exact and limited to what can be written down, the simulation is approximate and has almost no limits at all.
The procedure is short enough to state completely, and it uses the diagram exactly as drawn:
- For each of the eleven blocks, draw a life. Every block here is constant-rate, so
tᵢ = −ln(u) / λᵢwith u uniform on (0,1); a Weibull block would use its own inverse and nothing else in the procedure would change. - Mark each block up or down at the mission time: up if
tᵢ > 720. - Ask the structure function the question the diagram encodes: is any minimal path set intact, and are at least two of the three transmitters standing?
- Record success or failure, and repeat.
The estimate is the share of replications that succeeded. Seven of them, from seed 20260806:
| Replication | Blocks that died inside the mission | Verdict |
|---|---|---|
| 1 | none | air held |
| 2 | none | air held |
| 3 | D₂ at 465 h | air held |
| 4 | none | air held |
| 5 | none | air held |
| 6 | D₂ at 258 h | air held |
| 7 | none | air held |
Seven for seven, and the two interesting rows are the ones where a block died and the plant carried on. In replication 3 the second dryer failed at 465 hours and the path C₁·D₁ carried the air for the remaining 255; in replication 6 the same block died at 258 hours with the same result. That is the dryer pair doing its job and not the cross-tie: with only D₂ gone the D₁·D₂ cut is one failure short, and the system is up whether X is standing or not. X is pivotal only in the two order-3 cuts, a compressor and the dryer on the other train together, and those carry 0.6 per cent of the shortfall between them, so seven draws were never going to produce one.
Seven replications also estimate R̂ = 7/7 = 1.000, which is wrong in the way that matters: a mission that fails 2.24 times in a hundred shows no failure at all in seven draws about 85 per cent of the time. Continuing the same stream, the first replication the plant loses is run 37, and it loses to both compressors, at 145 hours and 497:
C₁ down, C₂ down → C₁·D₁ cut, C₂·D₂ cut, C₁·X·D₂ cut, C₂·X·D₁ cut
with all three transmitters still standing and the receiver, header and filter untouched. That is the largest order-2 cut of the analysis above, met in the wild: the simulation rediscovers the cut-set ranking without being told it.
A hundred thousand replications
| Replications | R̂ | Distance from the closed form |
|---|---|---|
| 10 | 1.000000 | +0.0224 |
| 100 | 0.980000 | +0.0024 |
| 1,000 | 0.978000 | +0.0004 |
| 10,000 | 0.975700 | −0.0019 |
| 100,000 | 0.977010 | −0.000575 |
0.977010 against the algebra's 0.977585, a gap of 575 parts per million, with 2,299 missions lost against the 2,242 the closed form predicts. The 95 per cent interval on the estimate is R̂ ± 1.96 √(R̂(1 − R̂)/n) = 0.97608 to 0.97794, and the exact answer sits inside it. The two methods are not checking each other's arithmetic here; they are checking each other's model, and they agree.
How many replications the question needs is arithmetic rather than taste. For a proportion, n = (z/ε)² · R̂(1 − R̂), so ±0.001 at 95 per cent confidence takes 86,288 of them: knowable before the run rather than discovered during it.
Why simulate at all, when the algebra worked
Because the algebra stops and the sampling does not. Everything in this chapter was chosen so that a closed form exists; four ordinary complications remove it, and none of them changes the four-step procedure above by more than a line:
| The complication | What it does to the algebra | What it does to the simulation |
|---|---|---|
| A Weibull block instead of a constant rate | The neat exponential products go | One line: draw from the Weibull inverse |
| Repairs during the mission | Outside the boolean model entirely | Give each block a restore time and keep a clock |
| One technician for two compressors | The blocks stop being independent | A queue in the simulation, and nothing else |
| The distribution of downtime, not its mean | No closed form at all | It is what the replications already produce |
The same generator, with restoration times added and the clock run for a year instead of a mission, reproduces the availability result too: 1.068 hours of downtime a year against the 1.078 the availability arithmetic above computes, from two thousand replications.
The point is that one drawing served both. The blocks, the paths and the vote were defined once; the algebra read them as a boolean expression and the simulation read them as a rule for judging a sample, and the two agree to within their sampling error.
What the model is still assuming
Both compressors are the same model from the same supplier, commissioned in the same week, maintained by the same crew on the same day. The base result treats their failures as independent, which is the most optimistic claim in the whole calculation.
| β on the compressor pair | System R(720) | Probability the mission fails |
|---|---|---|
| 0, the independence assumption | 0.977585 | 2.24% |
| 0.02 | 0.976155 | 2.38% |
| 0.05 | 0.974005 | 2.60% |
| 0.10 | 0.970409 | 2.96% |
| 0.20 | 0.963170 | 3.68% |
At β = 0.10 the shared-cause term contributes 0.86 percentage points on its own, which is more than the pair contributed in total when the failures were independent, and it is in series with the group: a third compressor does not touch it. Staggering the two overhauls so the pair is never opened in the same week is a procedural change that costs nothing and moves this table further than any hardware on it.
Two other assumptions are worth stating because they are invisible in the arithmetic. Nothing is repaired inside the 720 hours, so the answer is a floor rather than an estimate for a plant that can fix a compressor in a day. And the mission starts with everything working, which is untrue of any site that defers a defect to the next window.