

A new design does not meet its reliability requirement. That is not a failure of the engineering; it is the normal starting position, and every programme that has ever measured it has found the same thing. Reliability growth is the management of the gap: run the thing, find the modes, fix them, and track whether the fixes are arriving fast enough to close the gap before the money runs out.
The analysis in this module does two jobs. It says where the design is now, which is not the same as what the test has averaged. And it says whether the target is reachable at all, which is a question about the design and the programme rather than about the test schedule.
The loop, not the hours
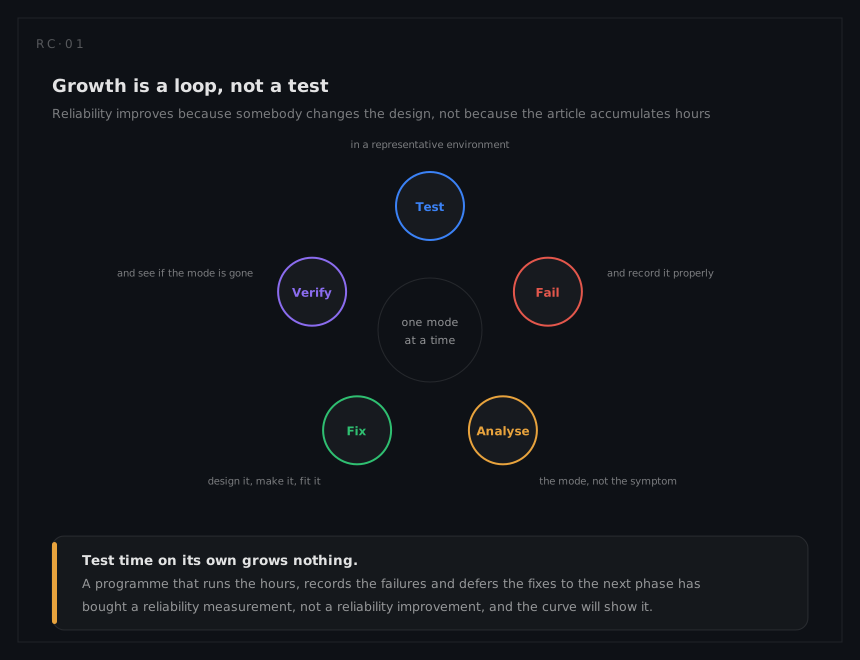
Everything here follows from one observation: the failure intensity falls only because modes are being removed. A test that finds failures and defers the fixes produces a flat curve, correctly. A test with an aggressive corrective action programme produces a falling intensity, and the models in this module are ways of measuring how fast.
Two numbers that get confused
| What it is | When to quote it | |
|---|---|---|
| Cumulative MTBF | Total time ÷ total failures, over the whole test | Almost never on its own |
| Instantaneous MTBF | What the current configuration is worth now | The answer to "where are we" |
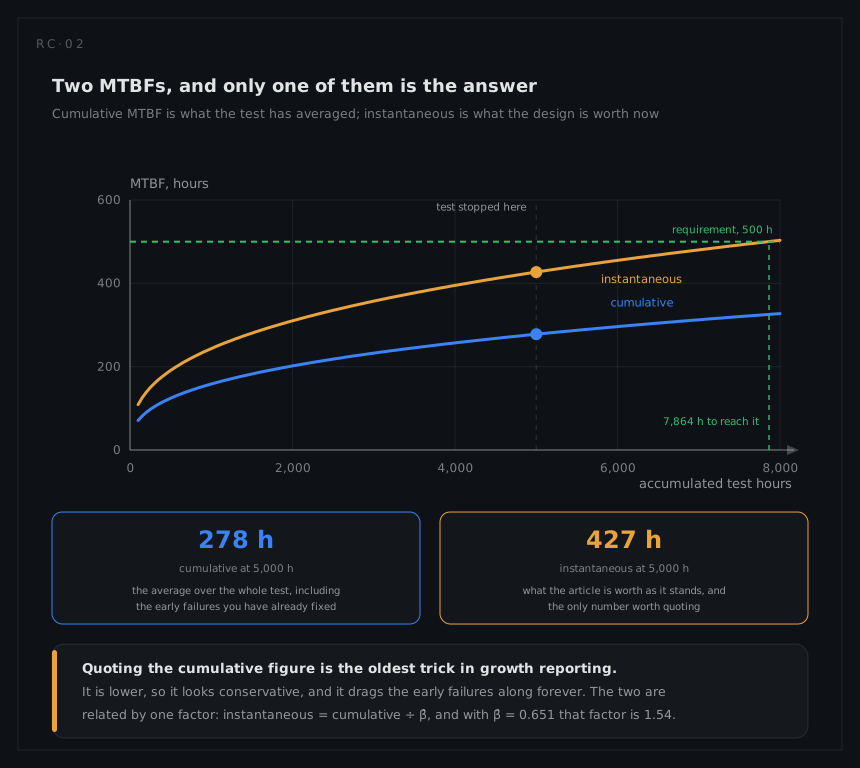
They are related by one factor, 1 ⁄ (1 − α), or equivalently 1 ⁄ β̂ on the fitted model, and reporting the first as though it were the second is the most common misstatement in growth reporting. On the worked example, where β̂ = 0.651, it is the difference between 278 hours and 427.
Where it sits
| Stage | What growth work looks like |
|---|---|
| Planning | An idealised curve from the initial MTBF to the requirement, with the test time and management strategy that make it plausible |
| Development test | Test-analyse-and-fix, with the model tracking where the design actually is |
| Corrective action periods | Projection: where the design will be once the identified fixes are embodied |
| Qualification | A different activity: demonstrating a fixed design against a requirement, not improving it |
| Service | Growth continues, informally, through FRACAS and the corrective actions it produces |
Where the discipline comes from
The Duane observation came first: plot cumulative MTBF against cumulative time on log-log axes during a development programme with active fixes, and the points fall near a straight line. That gave the growth rate α and a way of extrapolating, but no statistics.
The power law process, developed at the US Army Materiel Systems Analysis Activity and widely called the Crow or AMSAA model, put the same shape on a statistical footing: a non-homogeneous Poisson process whose intensity falls as a power of time, with maximum likelihood estimators, confidence bounds and goodness-of-fit tests. MIL-HDBK-189C is the US reference for the whole activity, and it separates planning, tracking and projection as three different exercises. On the international side, IEC 61164 covers the statistical test and estimation methods and IEC 61014 covers growth programmes as a management activity.
The two are the same curve seen twice, joined by α = 1 − β. The foundations derive both, and the difference that matters in practice is not the shape but what comes with it: the plot gives a slope and nothing else, while the process gives an estimator with an exact bias correction, exact confidence bounds and a test of whether the model fits at all.
What it is not
- It is not qualification testing. Growth improves a design; a demonstration measures a frozen one against a requirement with a stated risk. Running one and reporting it as the other is a category error that certification authorities notice.
- It is not a prediction of field reliability. It is evidence about a test article, in a test environment, under a particular set of failure-counting rules.
- It is not a way to reach any target. Above the growth potential, no amount of test time helps, and the arithmetic that says so is worth doing before the test rather than after.
- It is not a substitute for FRACAS. The loop is a FRACAS running fast, and if the reporting and analysis discipline is not there, neither is the growth.