

Two engine-driven integrated drive generators, an auxiliary power unit generator, a ram air turbine, two generator control units and the contactors that tie the buses together. The safety question is a single sentence: how often can this aeroplane lose all of its alternating-current power in flight, and is the answer small enough. Everything on this page exists to make that sentence checkable.
The technique, and why this one
A functional hazard assessment to decide what has to be demonstrated and how hard, then a combined FMECA (Task 101 and Task 102 together) to build the mode inventory and rank it by criticality, then a fault tree built from the severity-I modes, read for cut-set order before it is read for numbers. The order matters, and all three steps are load-bearing.
The FHA is functional: it needs no architecture, only a statement of what the system is for, which is why it can run before anything has been designed. It names the failure conditions and attaches a quantitative objective to each. An inductive FMECA then answers "what does each failure do", which is how the inventory gets built and how nothing is forgotten. A deductive fault tree answers "what combinations produce this outcome", which is how the architecture gets tested. Running only one of the last two leaves a characteristic hole: FMECA alone misses the combinations, and a fault tree alone misses the mode nobody thought to put in it. Running neither of them without the FHA leaves a worse one, because nothing says which outcome was worth analysing.
The functional hazard assessment comes first
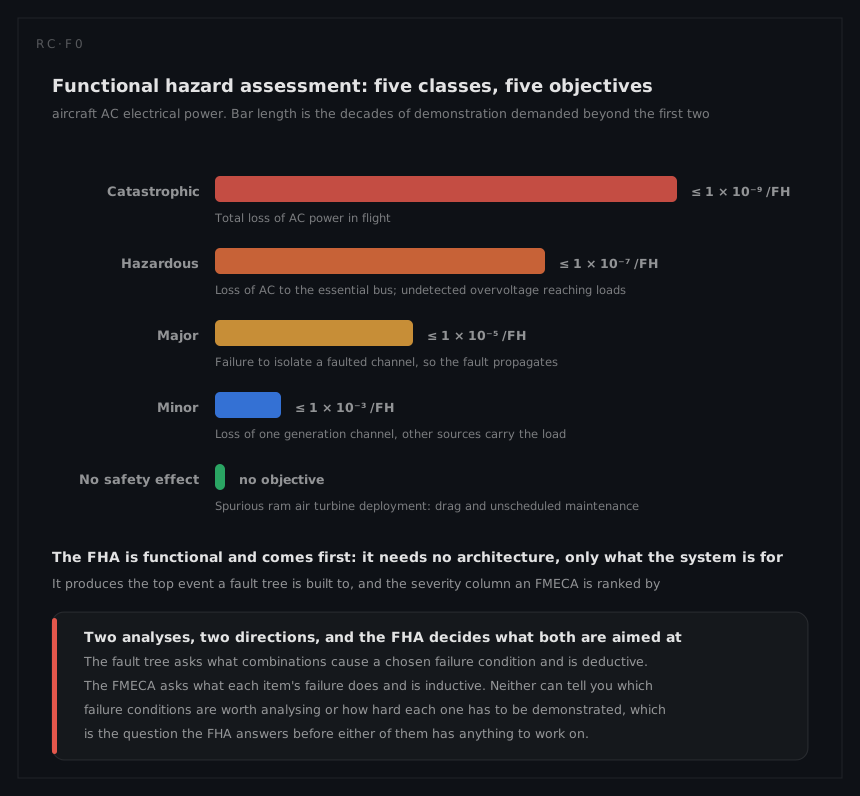
The FHA asks a question with no hardware in it: what is this system for, and what happens if it stops doing that, or does it wrongly, in each phase of flight. The answers are failure conditions, and each one is classified and given a quantitative objective. Transport-category civil practice, the scheme in FAA AC 25.1309-1B and the ARP4754B and ARP4761A process it sits inside, uses five classes with average-probability-per-flight-hour objectives descending by two decades a step.
| Function | Failure condition | Effect | Class | Objective |
|---|---|---|---|---|
| Supply AC power to aircraft loads | Total loss of AC power in flight | Loss of the flight-critical loads that have no other supply | Catastrophic | ≤ 1 × 10⁻⁹ /FH |
| Loss of AC to the essential bus | Essential loads lost while non-essential loads continue | Hazardous | ≤ 1 × 10⁻⁷ /FH | |
| Deliver power within tolerance | Undetected overvoltage reaching connected loads | Damage to avionics that were working a moment earlier | Hazardous | ≤ 1 × 10⁻⁷ /FH |
| Isolate a faulted channel | Failure to isolate, so the fault propagates | A local fault becomes a system fault | Major | ≤ 1 × 10⁻⁵ /FH |
| Supply AC power to aircraft loads | Loss of one generation channel | Other sources carry the load; capacity reduced | Minor | ≤ 1 × 10⁻³ /FH |
| Provide emergency power | Spurious ram air turbine deployment | Drag, noise, unscheduled maintenance | No safety effect | no objective |
Three things follow from this table and nothing else on the page can supply them.
It names the top event. The fault tree below exists because the first row exists. Without the FHA an analyst chooses a top event by intuition, and the usual result is a tree built around the failure that seemed most likely rather than the one that matters most.
It sets the number the tree has to beat. A target of 1 × 10⁻⁹ per flight hour is not a house style; it is what the classification buys, and it is why the architecture has four sources rather than three.
It supplies the severity column of the FMECA. Every entry in the Sev column of the worksheet below is a reference back to this table. That is what keeps two analyses consistent: they are not two independent opinions about how bad things are, they are one opinion applied twice.
The phase dependency is the part most often lost. Total loss of AC power on the ground is an inconvenience and in flight it is catastrophic, so the classification belongs to the pair (function, phase) and never to the function alone. The same discipline is what makes the last row honest: a spurious ram air turbine deployment is expensive and embarrassing and it is not a safety matter, so it earns no objective and no further analysis.
Criticality: the half of the FMECA that gets skipped
The criticality half, Task 102, is what turns a list into a ranking, and it is the step most often left out. Its arithmetic is
Cm = β · α · λp · t
the mode criticality number, where α is the mode ratio, β the conditional probability that the mode produces the stated severity, λ_p the item failure rate and t the mission time of 5 hours. Item criticality is Cr = Σ Cm over that item's modes within a severity class.
The worksheet
Rates per 10⁶ flight hours; Cm in units of 10⁻⁶ per 5-hour flight. Severity classes are Catastrophic (I), Critical (II), Marginal (III) and Negligible (IV).
| # | Item | Failure mode | α | λ_m | End effect | Sev | β | Cm |
|---|---|---|---|---|---|---|---|---|
| 1 | IDG | Loss of output | 0.55 | 137.5 | Channel lost, other sources carry | III | 0.001 | 0.69 |
| 2 | IDG | Overvoltage output | 0.10 | 25.0 | Connected loads damaged before trip | II | 0.10 | 12.50 |
| 3 | IDG | Degraded output | 0.20 | 50.0 | Reduced capacity, load shed | III | 0.0005 | 0.13 |
| 4 | IDG | Drive mechanical failure | 0.15 | 37.5 | Channel lost | III | 0.001 | 0.19 |
| 5 | GCU | Fails to trip on fault | 0.25 | 22.5 | Fault not isolated, damage propagates | II | 0.05 | 5.63 |
| 6 | GCU | Spurious trip | 0.45 | 40.5 | Channel lost unnecessarily | III | 0.0005 | 0.10 |
| 7 | GCU | Loss of regulation | 0.20 | 18.0 | Voltage excursion, loads at risk | II | 0.02 | 1.80 |
| 8 | GCU | Undetected internal fault | 0.10 | 9.0 | Protection absent when demanded | I | 0.002 | 0.09 |
| 9 | Contactor | Fails open | 0.60 | 15.0 | Bus segment lost | III | 0.001 | 0.08 |
| 10 | Contactor | Welded closed | 0.30 | 7.5 | Fault cannot be isolated | II | 0.02 | 0.75 |
| 11 | Contactor | High resistance | 0.10 | 2.5 | Heating, progressive | III | 0.001 | 0.01 |
| 12 | APU generator | Fails to start | 0.40 | 120.0 | Backup source absent on demand | I | 0.001 | 0.60 |
| 13 | APU generator | Loss of output in run | 0.45 | 135.0 | Backup source lost | I | 0.001 | 0.68 |
| 14 | APU generator | Degraded output | 0.15 | 45.0 | Reduced backup capacity | III | 0.0005 | 0.11 |
| 15 | RAT | Fails to deploy | 0.65 | 26.0 | Last-resort source absent | I | 0.002 | 0.26 |
| 16 | RAT | Deploys, no output | 0.25 | 10.0 | Last-resort source absent | I | 0.002 | 0.10 |
| 17 | RAT | Spurious deploy | 0.10 | 4.0 | Drag, noise, unscheduled maintenance | IV | 0.0001 | 0.00 |
Worked for one row, so the arithmetic is visible. IDG overvoltage:
Cm = β · α · λp · t = 0.10 × 0.10 × 250 × 10⁻⁶ × 5 = 1.25 × 10⁻⁵
Item criticality for the generator control unit in class II:
Cr(GCU, II) = 5.63 + 1.80 = 7.43 × 10⁻⁶
What the ranking says
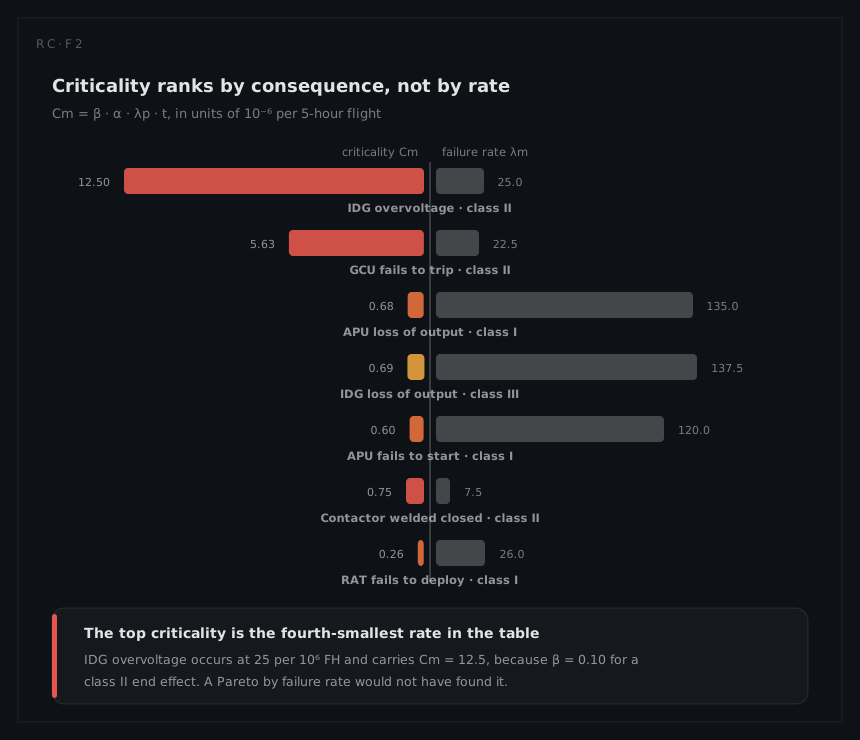
The top of the criticality ranking is IDG overvoltage at Cm = 12.50, a mode whose failure rate of 25 per 10⁶ flight hours is ninth of the seventeen, squarely mid-pack. Second is GCU failure to trip at 5.63, on a rate lower still. Meanwhile the two largest failure rates in the system, IDG loss of output at 137.5 and APU loss of output at 135.0, sit near the bottom of the criticality list.
That inversion is the entire reason Task 102 exists. A Pareto ordered by failure rate would have sent the programme after the generators; the criticality ranking sends it after the protection, because a generator that stops is an inconvenience the architecture already absorbs, and a generator that pushes 200 volts into the avionics with a control unit that fails to trip is a different kind of event. The mode ratio α and the conditional probability β are where the engineering judgment lives, and they should be argued in review rather than filled in from a template.
The other thing the worksheet does is populate the tree. Five modes carry class I: the GCU internal fault, both APU modes and both RAT modes. Those, plus the channel-loss modes that must coincide, are the basic events of the fault tree below. Nothing enters the tree that did not come from the worksheet, and nothing in the worksheet with a class I effect is allowed to be absent from it. That reconciliation, run as a checklist, is the cheapest error-catching step in the whole assessment.
The fault tree
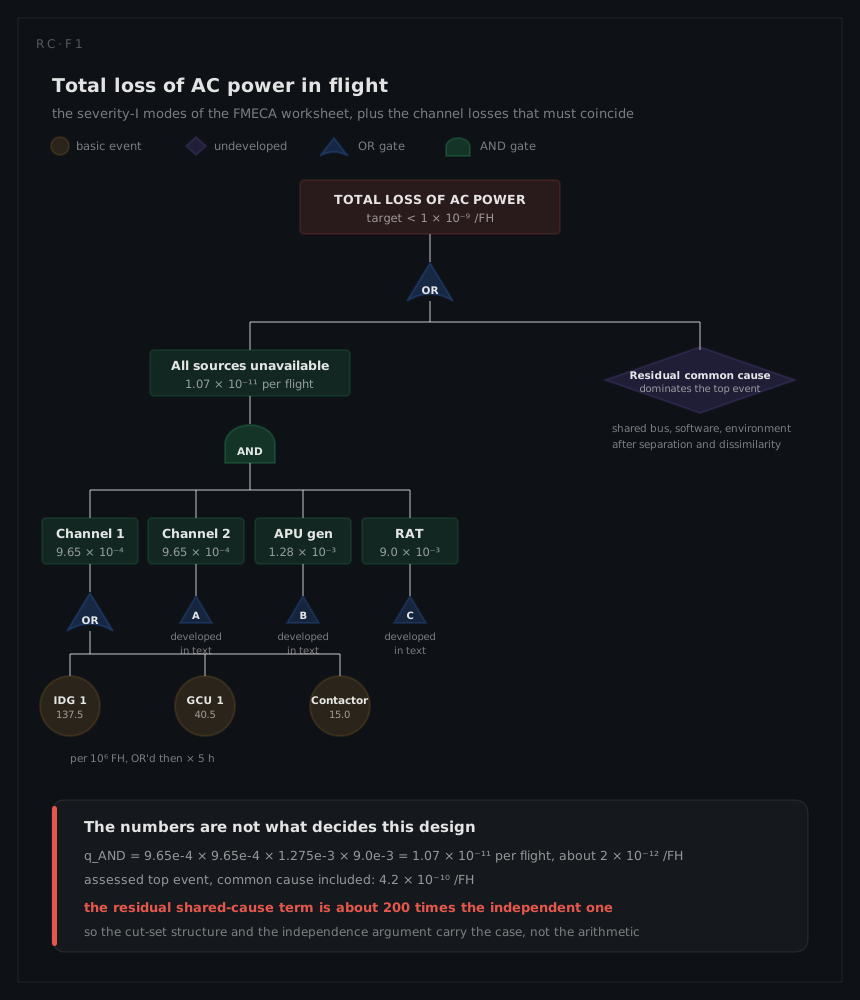
The top event is total loss of AC power in flight, classified Catastrophic, with a target below 1 × 10⁻⁹ per flight hour. Beneath it an OR gate separates two completely different ways of getting there: all four sources failing independently, and a single shared cause taking them together.
Each channel is an OR of its three contributors, so over the 5-hour flight
qch = (137.5 + 40.5 + 15.0) × 10⁻⁶ × 5 = 9.65 × 10⁻⁴
The APU is a demanded source with two ways of being absent:
qAPU = (120 + 135) × 10⁻⁶ × 5 = 1.275 × 10⁻³
The ram air turbine is dormant, so its unavailability is not a mission-time calculation at all. With a functional check every 500 flight hours it follows the latent-failure average from the foundations chapter:
qRAT = λT / 2 = 36 × 10⁻⁶ × 500 / 2 = 9.0 × 10⁻³
The rate in that expression is the 36 per 10⁶ hours of silent modes, not the turbine's whole 40. Spurious deploy is caught by continuous built-in test, so it never lies latent between functional checks and has no place in a λT/2 term; it costs dispatch time rather than protection, and it is counted on the availability page instead.
The AND gate multiplies:
qAND = 9.65 × 10⁻⁴ × 9.65 × 10⁻⁴ × 1.275 × 10⁻³ × 9.0 × 10⁻³ = 1.07 × 10⁻¹¹ per flight
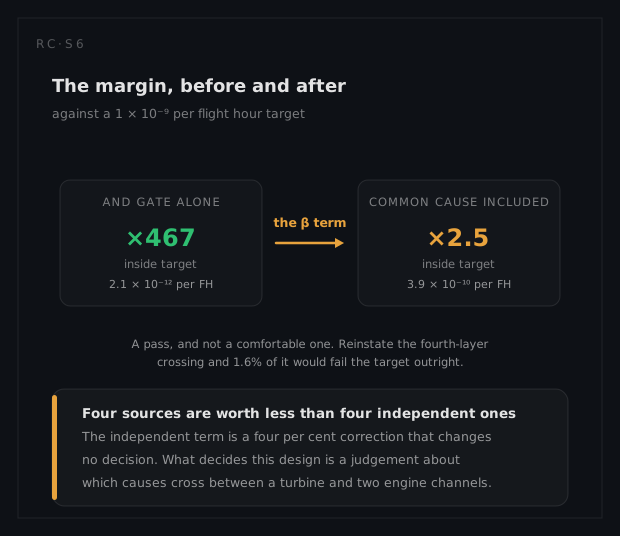
which over five hours is 2.14 × 10⁻¹² per flight hour, nearly five hundred times below the target and apparently the end of the matter.
Reading the structure before the number
It is not the end of the matter, and the reason is visible in the tree rather than in the arithmetic. Three observations, in the order a reviewer should make them.
The cut-set order is four, and that is the finding that counts. No single failure produces the top event, which is what a catastrophic classification requires in civil aviation certification practice, and the tree demonstrates it structurally rather than probabilistically. Had any branch resolved to a single basic event, no probability however small would have rescued the design.
The ram air turbine dominates the product by an order of magnitude. At 9.0 × 10⁻³ against a channel's 9.65 × 10⁻⁴ it is about ten times less available, entirely because it is dormant and checked every 500 hours rather than because it is unreliable. Halving the check interval halves the term; improving the turbine barely moves it. That is a maintenance decision masquerading as a hardware one, and the testability page works it as a coverage problem.
The undeveloped diamond is the real answer. The assessed top-event value, with residual shared causes included, is 3.9 × 10⁻¹⁰ per flight hour, which is roughly two hundred times the independent term; the next section opens the diamond and derives it. Everything the AND gate computed is noise beside it. The design earns its number not from the multiplication but from what was done to make the multiplication legitimate: separate engines, separate accessory gearboxes, separated routing, dissimilar control-unit software, independent buses. Those measures are not in the tree; they are the argument that the tree is allowed to multiply, and the common cause analysis is where they get audited.
Quantifying the diamond
An undeveloped diamond in a submitted tree is an admission rather than a result, and the first question a reviewer asks is what is inside it. Opening it needs a model of shared causes, and the instrument is the beta factor: the same one the diesel pair uses, applied to a harder case, because these four sources are not two copies of one machine.
A notational point first, because two conventions collide on this page. β already means the FMECA conditional probability in Cm = β · α · λp · t, so the common-cause fraction is written βcc below. It is the quantity the nuclear page calls plain β, where nothing competes for the letter.
A beta factor is a claim about a group: members that share a design, a part number, a process, a procedure, a space or an environment, with a fraction βcc of each member's unavailability attributed to causes that fail every member at once. The four sources are not a group, and the arithmetic refuses before any judgment is needed. One group at βcc = 0.02 across all four would put the top event at βcc · qch = 0.02 × 9.65 × 10⁻⁴ = 1.93 × 10⁻⁵ per flight, 3.9 × 10⁻⁶ per flight hour, nearly four thousand times the target. That is not a conservative answer, it is a wrong model, and its wrongness is the physical statement that a wind-driven turbine in the tail does not stop because an accessory gearbox in a wing pylon did. The groups therefore have to be built in layers, each wider than the last and each weaker:
| Common-cause group | What its members share | What separates them | βcc |
|---|---|---|---|
| Channel 1 and channel 2 | Generator and control-unit part numbers, one maintenance procedure, one installation crew, fuel from common tanks, the air the engines ingest | Engine, accessory gearbox, wiring route, bus, control-unit software load | 0.02 |
| Channels 1 and 2 and the auxiliary power unit | Fuel drawn from common tanks, and the air all three burn | Prime mover, accessory gearbox, wiring route, bus, control-unit software load | 0.01 of the pair's fraction, as a crossing |
| All four sources | The airframe | Prime mover, fuel path, gearbox, actuation, zone; the turbine shares none of them | 0, by requirement |
A beta factor carrying a conditional crossing fraction is the multiple Greek letter model, in which γ is the probability that a cause already defeating one group also defeats the wider group containing it. Published γ values are derived from identical redundant components, which is exactly why 0.01 for a dissimilar prime mover is an engineering judgment argued in review rather than a lookup, and why the sensitivity table below matters more than the point estimate.
The two engine-driven channels are the only strong group here, and even they are weaker than the diesels. The nuclear pair carries β = 0.05 with one building, one crew, one fuel tank and two identical machines. What survives the separation is what was never separated, namely two identical part numbers carrying whatever latent defect the design holds, one maintenance procedure written once and performed twice, one installation crew, one fuel supply and one atmosphere. βcc = 0.02 is a judgment that those five separations are worth a factor of two and a half against the diesel pair and no more, because nothing was done about the part numbers or the procedures.
The shared fraction becomes one basic event that fails both channels together:
qcc = βcc · qch = 0.02 × 9.65 × 10⁻⁴ = 1.93 × 10⁻⁵ per flight
Sanity-check it before it goes any further, because an unpicturable common-cause event is the commonest way a beta factor smuggles nonsense into a tree. This one is a shade under one flight in 52,000, against an independent coincidence of qch² = (9.65 × 10⁻⁴)² = 9.31 × 10⁻⁷, one flight in 1.07 million: the coupling makes simultaneous loss of both engine-driven channels 21 times more likely than multiplication says. Across 200 aeroplanes flying 600 sectors a year it predicts 2.3 dual-channel events a year, which an operator would notice. That is the useful property of the figure. βcc is auditable in service and not only in review, and a fleet that never sees the event has been assessed pessimistically while a fleet that sees more has already lost the argument.
Not every cause inside that event reaches the auxiliary power unit. The fuel-borne and air-borne ones do, because the APU burns the same fuel and breathes the same air; the gearbox, the wiring route, the bus tie and the maintenance error committed on a machine the APU does not have plainly do not. The assessment puts the crossing fraction at one in a hundred:
qcc3 = 0.01 × qcc = 0.01 × 1.93 × 10⁻⁵ = 1.93 × 10⁻⁷ per flight
one flight in 5.2 million, or loss of all three fuel-burning sources about once in forty years across that same fleet.
The crossing to the ram air turbine is zero, and it is zero by requirement rather than by estimate. An event failing all four sources is an order-one cut set under a catastrophic classification, which the first observation above disposed of on structural grounds: no probability, however small, rescues it. The separation measures are therefore not credited with shrinking a term, they are credited with deleting one, and the price of that credit is that every measure becomes a verifiable requirement whose evidence is the zonal, particular risks and common mode studies. The turbine can carry the requirement, because it needs no fuel, no prime mover, no accessory gearbox and no engine bleed, it deploys on its own actuation path into its own zone, and the airframe is the only thing it shares.
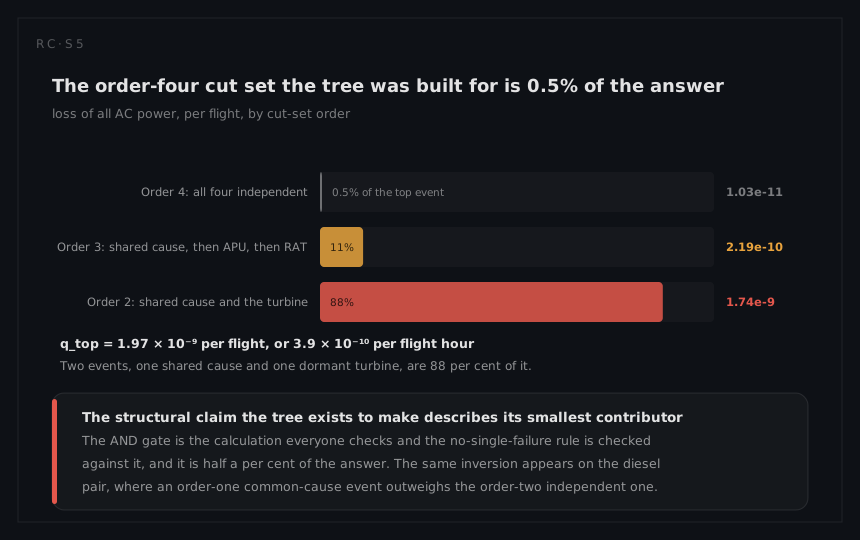
Four minimal cut sets remain, and the arithmetic is four lines.
order 4: (0.98 × 9.65 × 10⁻⁴)² × 1.275 × 10⁻³ × 9.0 × 10⁻³ = 1.03 × 10⁻¹¹
order 3: (0.99 × 1.93 × 10⁻⁵) × 1.275 × 10⁻³ × 9.0 × 10⁻³ = 2.19 × 10⁻¹⁰
order 2: 1.93 × 10⁻⁷ × 9.0 × 10⁻³ = 1.74 × 10⁻⁹
order 1: 0
| Minimal cut set | Order | Per flight | Share |
|---|---|---|---|
| Both channels, the APU and the turbine fail independently | 4 | 1.03 × 10⁻¹¹ | 0.5% |
| Shared cause on the channel pair, then the APU, then the turbine | 3 | 2.19 × 10⁻¹⁰ | 11% |
| Shared cause on all three generators, then the turbine | 2 | 1.74 × 10⁻⁹ | 88% |
| Shared cause on all four sources | 1 | 0 | designed out |
| Assessed top event | 1.97 × 10⁻⁹ |
qtop = 1.03 × 10⁻¹¹ + 2.19 × 10⁻¹⁰ + 1.74 × 10⁻⁹ = 1.97 × 10⁻⁹ per flight
qtop = 1.97 × 10⁻⁹ / 5 = 3.9 × 10⁻¹⁰ per flight hour
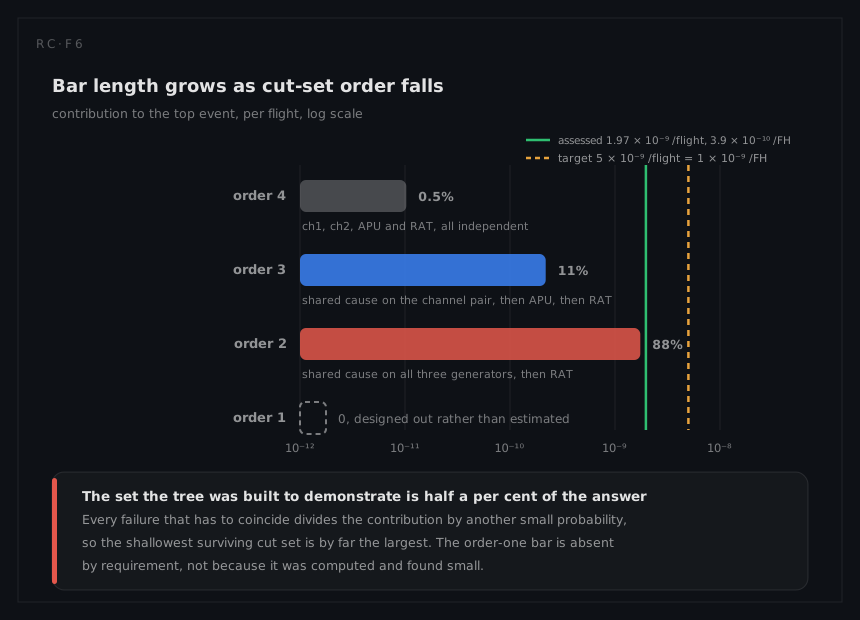
The dominant cut set is order two, so the structural claim the tree was built to make describes its smallest contributor. The order-four set that the AND gate computed, and that the no-single-failure rule was checked against, is half a per cent of the answer. Eighty-eight per cent of it is two events: one shared cause and one dormant turbine. That is the same inversion the diesel pair shows, where an order-one common-cause event outweighs the order-two independent one, and it arrives here for the same reason. The difference is that the aircraft is forbidden its order-one set and the plant is not, and the prohibition is doing quantitative work as well as structural work: reinstate the fourth-layer crossing and the design fails its target as soon as more than about 1.6 per cent of the causes that defeat all three generators also defeat the turbine. Working the break-even in per-flight-hour currency, (1 × 10⁻⁹ − 3.9 × 10⁻¹⁰) / (1.93 × 10⁻⁷ / 5) = 0.016, which is the one and a half to two per cent of a crossing fraction standing between this design and its target.
What the assessed number rests on
Reconcile it with the AND gate first. Removing the shared fraction from each channel lowers the independent term from 1.07 × 10⁻¹¹ to 1.03 × 10⁻¹¹, a four per cent correction that changes no decision, which is the usual fate of the term a tree spends most of its ink on. The assessed 1.97 × 10⁻⁹ per flight is 1.97 × 10⁻⁹ / (1.07 × 10⁻¹¹) = 184 times that term, the factor of roughly two hundred the third observation quoted. What changes is the margin. The AND gate left several hundred times the target in hand; the assessed figure leaves 1 × 10⁻⁹ / (3.9 × 10⁻¹⁰) = 2.5, which is a pass and not a comfortable one, and is the honest description of an architecture whose four sources are worth considerably less than four independent sources.
Two of the model's inputs are judgments with no data behind them, and the assessed figure is linear in both:
| Change from the assessment | Top event per flight hour | Margin on 1 × 10⁻⁹ /FH |
|---|---|---|
As assessed: βcc = 0.02, crossing 0.01 | 3.9 × 10⁻¹⁰ | 2.5 |
βcc = 0.04: the five separations worth half what was claimed | 7.8 × 10⁻¹⁰ | 1.3 |
| Crossing 0.05: the APU less separated than argued | 1.8 × 10⁻⁹ | fails, at 1.8 times the target |
| Turbine checked every 250 flight hours | 2.0 × 10⁻¹⁰ | 5.1 |
| Every failure rate in the worksheet halved | 9.2 × 10⁻¹¹ | 11 |
Three readings follow, in the order a programme should act on them.
A crossing fraction of five per cent instead of one per cent fails the aeroplane. Nothing in the worksheet, the FHA or the tree constrains that parameter; it is a judgment about how much of a fuel supply and an air mass two dissimilar prime movers really have in common, and it decides certification. The diesel pair reaches the same conclusion from its own data, where perturbing β costs ten times what perturbing a measured probability does, and the rule generalises: the uncertainty that matters is the coupling, not the rates.
The turbine's check interval is a lever on the whole answer rather than on one branch of it. With the order-one cut set deleted, qRAT is a factor in every surviving term, so halving the interval to 250 flight hours halves the assessed figure exactly, 3.9 × 10⁻¹⁰ to 2.0 × 10⁻¹⁰. The second observation above called the interval a maintenance decision masquerading as a hardware one when it applied to the AND gate alone. With common cause included it is the cheapest change available, and the comparison makes the point: halving every failure rate in the worksheet buys a factor of 4.3, but half of that factor is the turbine's own rate halving, which is arithmetically the same change as halving the interval. The other sixteen rates are worth 2.1 between them, and no programme can buy that either. The testability page works the same interval as a coverage problem, and detection that shortens the exposure without a scheduled check attacks the identical term.
The one assumption in this model that carries no number has to be discharged by the qualitative studies. The groups above are nested, which encodes the claim that any cause reaching the APU generator has already taken both channels. A cause defeating one channel and the APU while sparing its identical sister would be a zonal or particular-risk event (a fire in one bay, a rotor burst arc, a wiring route carrying more than the drawing admits) rather than a design or procedural coupling, and it would add a further order-three cut set of the same shape as the one worth 2.19 × 10⁻¹⁰. Such events are eliminated by the separation requirements rather than priced here, and that elimination is what the zonal safety analysis and the particular risks analysis exist to verify item by item. The figure on this page holds only if the common cause analysis closes with no findings, which is the sentence the safety case must be able to say and the reason the analysis order at the top of this page put the qualitative work first.
What a different technique would have given
Running the fault tree without the FMECA behind it would have produced a tidy and defensible-looking tree containing only the modes the analyst thought of. Overvoltage would very likely not have been among them: it is a low-rate mode, it does not cause loss of the channel, and it does not appear anywhere in a top event about losing power. The FMECA finds it because the FMECA asks what each failure does rather than what causes a chosen outcome, and it ranks it first because Task 102 weights by consequence. A programme that runs only the deductive analysis systematically misses the modes whose harm lies outside the top event it chose to analyse, which is precisely the class of mode that later appears in an accident report as "not considered".