

Six hundred volumetric infusion pumps in one hospital, each running about 2,500 hours a year. A pumping mechanism, an occlusion sensor, an air-in-line detector, a dose controller with its user interface, and a rechargeable battery. The dominant hazard is over-infusion, meaning the patient receives more drug than intended, and the uncomfortable finding on this device is that most of the time it is delivered by a pump that is working exactly as designed.
That single observation reorganises the whole safety programme. Every other system in this chapter has a hazard that begins with something breaking, which is why a failure rate is a reasonable starting point for all of them. Here the analysis apportions the over-infusion hazard and finds that programming and setup error, which is to say use-related causes, contribute about four fifths of it, and device failure the remaining minority. The λ table is not wrong. It is a minority report, and a safety case built on it would be quantitatively impeccable and substantially beside the point.
The technique, and why this one
A hazard analysis whose top event is over-infusion rather than device failure, with the causes apportioned between a device branch that can be quantified from failure rates and a use-related branch that cannot, and with the two mechanical items separated from the electronics before anything is fitted. The apportionment is the technique. A fault tree drawn under "over-infusion" has two subtrees; only one of them has component data underneath it; and the one with the data is the smaller one.
| Branch or item | Model | Value | Share of the hazard |
|---|---|---|---|
| Use-related: programming and setup error | task analysis, not rate-based | no λ exists | about four fifths |
| Device failure, all causes | see below | 1,460 per 10⁶ h | the remaining fifth |
| Pumping mechanism | Weibull, β = 1.6, η = 3,700 running hours | 300 per 10⁶ h book value | wear on the plunger drive |
| Occlusion sensor | exponential | 150 per 10⁶ h | |
| Air-in-line detector | exponential | 120 per 10⁶ h | the safety-critical detection function |
| Dose controller board | exponential | 90 per 10⁶ h | |
| Battery | Weibull, β = 3.4, η = 5,300 calendar hours | 800 per 10⁶ h | replaced on a seven-month cycle |
Two clocks run in that table and confusing them is the most common error on this device. The mechanism wears on running hours, 2,500 a year. The battery ages on the wall clock whether the pump runs or not, 8,760 a year, which is why its characteristic life is quoted in calendar hours and why its replacement policy is written in months.
The arithmetic of a ceiling
The device branch is straightforward. Summing the items:
λpump = 300 + 150 + 120 + 90 + 800 = 1,460 per 10⁶ h
maintenance actions per pump-year = 1,460 × 10⁻⁶ × 2,500 = 3.65
fleet actions per year = 3.65 × 600 = 2,190
Now put those numbers where they belong. Write the total hazard as H, the device branch as D and the use branch as U, with U = 0.8H and D = 0.2H, so U/D = 4. The consequence is a hard ceiling on what device engineering can achieve:
H' (perfect device) = H − D = 0.8H
A programme that eliminated device failure entirely, driving 1,460 per 10⁶ hours to zero, would remove twenty per cent of the hazard. That is the best case, not the expected case, and it is bought with the most expensive engineering available.
Set that beside the other branch:
0.25 × U = 0.25 × 0.8H = 0.20H
A twenty-five per cent reduction in use error, which is a modest outcome for a serious usability programme, removes exactly as much hazard as a perfect device. Halving the device contribution, which is an ambitious hardware target, removes 0.5 × 0.2H = 0.10H, and is matched by a 12.5 per cent reduction in use error. The comparison is not close and it does not depend on any number the specification sheet does not already contain.
There is a blunter check available. Suppose an analyst took the item failure rate as the hazard rate, which happens more often than anyone admits. That reads 3.65 over-infusions per pump-year, so H = 3.65/0.2 = 18.25 per pump-year and U = 14.6, giving 10,950 hazardous events a year across 600 pumps. Nothing remotely like that occurs, and the mismatch is the point: an item failure rate is not a hazard rate, and the gap between them is the mode split the λ table does not carry. Closing it is what an FMEA exists to do, and it is the step most often skipped when a component rate is available and a mode split is not.
The wear-out item whose policy is set at the wrong percentile
The battery is the one place on this page where conventional reliability arithmetic changes a safety decision directly, and it changes it by more than most people expect. With β = 3.4 and η = 5,300 calendar hours, the seven-month replacement cycle falls at 5,300 hours, exactly at η. Survival at the replacement date is
R(5,300) = exp(−(5,300 / 5,300)^3.4) = exp(−1) = 0.368
Sixty-three per cent of these batteries have already failed by the day they are due to be changed. A policy set at the characteristic life is a policy set at the point where roughly two units in three are gone, and it looks defensible only because nobody computes the survival. For a wear-out item the replacement age belongs at a low percentile:
B10 = η(−ln 0.9)^(1/β) = 5,300 × (0.10536)^(1/3.4) = 5,300 × 0.5159 = 2,734 h
about 3.7 months on the calendar clock the battery ages against. Moving the cycle from the 7.3 months the policy runs to 3.7 takes the population from 63 per cent failed to 10 per cent failed at replacement. The safety weight of that is not the battery itself but what the battery is for: continuity of infusion during transport between wards and during a mains interruption. It is the same trap the aggregate data hides, because replacing at η truncates the population just where the wear-out signature would have shown, which is why the fleet returns look like a constant-rate item until the mechanisms are separated, as they are on the reliability page.
The detector, and why coverage has to be per mode
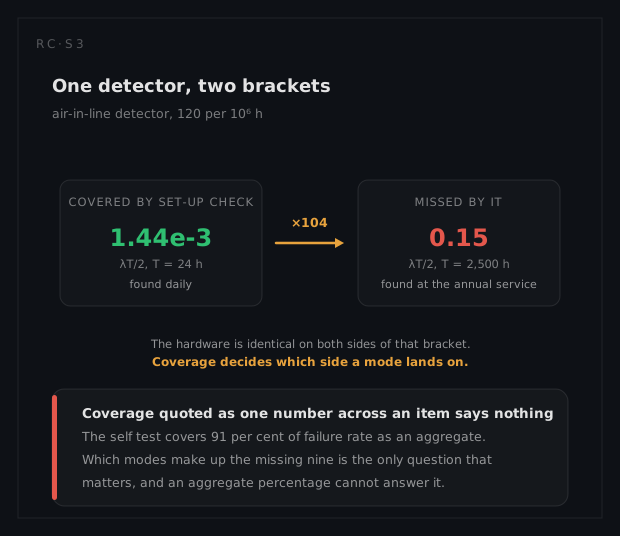
The air-in-line detector at 120 per 10⁶ hours is the safety-critical detection function, and its contribution depends entirely on whether the power-on self test reaches the mode that matters. The self test covers 91 per cent of failure rate as an aggregate, and aggregates are not what protects a patient.
Bracket it. If the self-check reaches the mode and runs at every set-up, with a set-up interval of the order of a day, the exposure is
λT/2 = 120 × 10⁻⁶ × 24 / 2 = 1.44 × 10⁻³
If the mode falls outside the self-check, the next thing that would find it is the annual preventive service, so T is a pump-year of 2,500 operating hours:
λT/2 = 120 × 10⁻⁶ × 2,500 / 2 = 0.15
A factor of 104 between the two, and the detector is identical in both. Which side of that bracket a mode lands on is decided by coverage, not by the hardware, and coverage quoted as one number across an item tells you nothing about it. The testability page works the release-to-use gate that the self test actually is.
The feedback loop is misreporting its own dominant hazard
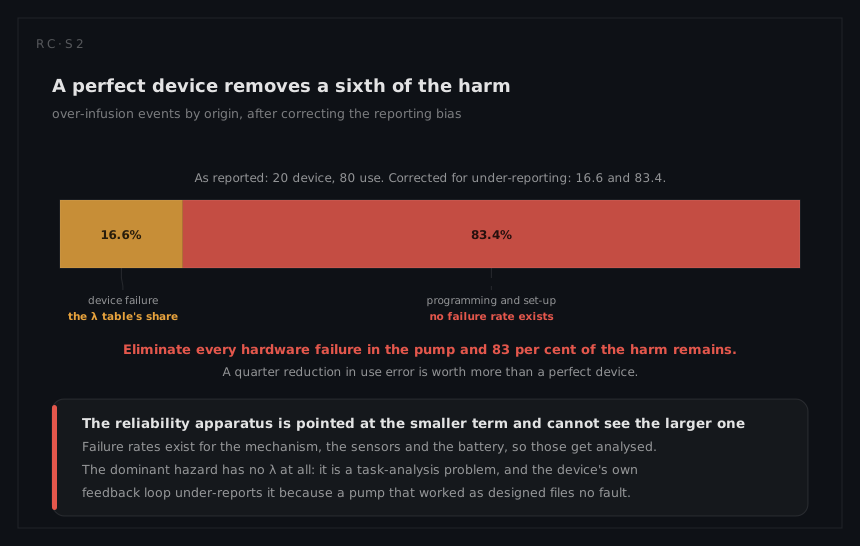
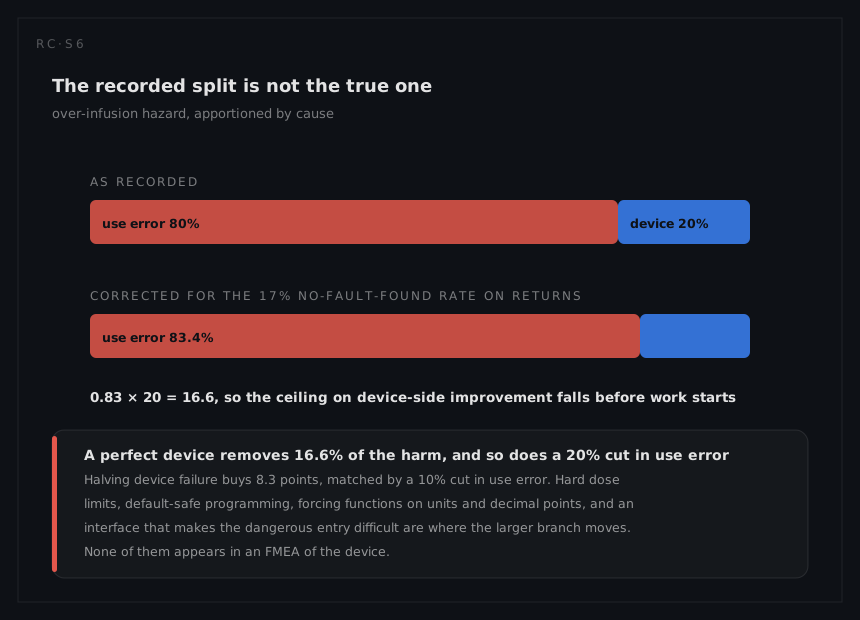
Returned pumps show 17 per cent no-fault-found, mostly setup error reported as device failure. That is not only a warranty cost; it is a systematic bias in the evidence the safety programme uses. If 17 per cent of what the organisation records in the device column is really use-related, then on the recorded 20/80 split the true device share is
0.83 × 20 = 16.6, so the true split is 16.6 device to 83.4 use
and the ceiling on device-side improvement falls from 20 per cent to 16.6 per cent. The bias runs in the direction that makes the problem look more like a hardware problem, and it does so while looking like evidence. Left alone it pushes investment towards components and away from the interface, year after year, with data apparently supporting it.
What the analysis tells the engineer to do
Move the safety budget to the interface, and treat what happens there as hazard control with the standing of a redundant sensor rather than as styling. Constrain the dose ranges the device accepts. Require explicit confirmation where a misplaced decimal point changes the delivered dose tenfold. Make the dangerous entry impossible where you can, hard where you cannot, and conspicuous where it must remain possible, which is the order of precedence set out in the design chapter. Unlike an instruction in a manual, every one of those is testable.
Reset the battery replacement to B10, under four months rather than seven.
Change what the incident system records. It must capture what the user was doing, not only what the device was doing, or the 17 per cent will keep converting use error into hardware findings. Correcting the attribution needs a FRACAS designed to ask the question.
Establish the detector's self-check coverage mode by mode, and accept nothing quoted as a single percentage of item rate.
What a different technique would have given
Run the conventional programme instead: a component FMEA with risk-priority scoring, fed by a prediction, producing a device-failure safety case. It would deliver 1,460 per 10⁶ hours, 3.65 failures per pump-year, 2,190 fleet events, a ranked list of components and a set of design actions against the top of it. Every figure would be defensible and the whole exercise would be capped, arithmetically, at a twenty per cent reduction in the hazard it claims to address.
Worse, the ranking would point in the wrong direction. Sorted by failure rate the battery comes first at 800 per 10⁶ hours and the interface does not appear at all, because the interface has no failure rate: it does precisely what it was designed to do. A method whose unit of analysis is the failure of a component is structurally incapable of seeing a hazard produced by a component behaving correctly, which is the case examined at length in the systems chapter. On this device the dominant hazard arrives through a working pump, and no amount of rigour applied to the failing ones will reach it.