

A gas turbine driver, a centrifugal compressor, a lube oil system with a duty and a standby pump, three vibration sensors voted two out of three, a trip logic solver and a shutdown valve. The machine runs continuously for four years between turnarounds and the protective function at the end of it moves perhaps never. The safety question on this train is not whether the compressor fails; it is whether the valve that stops it will close when it is finally asked.
That question cannot be answered with a failure rate, because the valve is not operating. It sits, it degrades while it sits, and nothing reveals the degradation until someone tests it or a real demand arrives. The quantity the process sector uses instead is the average probability of failure on demand, and its interesting property is that it is set as much by the test schedule as by the hardware. This train's shutdown function fails its target on a calendar rather than on a fault, and recovers it the same way.
The technique, and why this one
Average probability of failure on demand for a low-demand safety instrumented function, with the proof-test interval treated as the governing design variable. A dormant item tested at interval T is on average halfway through its exposure window when a demand arrives, which gives PFD ≈ λDU × T / 2. Everything below follows from that expression being linear in both T and the undetected dangerous rate, and from what the site can and cannot do to either.
| Element | Model | Value | Role |
|---|---|---|---|
| ESD shutdown valve | dormant, PFD = λDU·T/2 | λ total 40, λDU 12 per 10⁶ h | final element, the constraint |
| Trip logic solver | exponential, continuously diagnosed | 30 per 10⁶ h, λDU 0.15 | not the constraint |
| Vibration sensor, 3 fitted | exponential, 2oo3 vote | 200 per 10⁶ h each, λDU 2 | initiator |
| Sensor common cause | beta factor | β = 0.05 | what the vote cannot remove |
| Proof test, full stroke | interval | 12 months, 8,760 h | reveals the valve |
| Partial stroke test | credited as automatic diagnostic | 3 months | reduces the undetected fraction |
| Turbine hot section | Weibull, β = 3.1, η = 52,000 h | 350 per 10⁶ h book value | source of demands |
| Target integrity | SIL 2 | PFD between 10⁻³ and 10⁻² in this sector's scheme | risk reduction 100 to 1,000 |
| Architectural constraint | minimum hardware fault tolerance, per subsystem | set by the level claimed and the safe failure fraction | the second requirement, alongside the PFD |
Three lines deserve comment before the arithmetic. The valve's total rate is 40 per 10⁶ hours and only 12 of it is dangerous and undetected; the rest fails safe, announces itself, or is found by ordinary maintenance. Quoting 40 would overstate the answer by 3.3 and would be wrong in principle, because a revealed failure gets repaired and a safe failure trips the train. And the SIL bands belong to the process sector's scheme; they do not transfer as written to the aircraft, the vehicle or the crossing elsewhere in this chapter. The third is that the dangerous undetected rates given for the solver and the sensors are worked out below rather than quoted from a book: each is what survives continuous diagnostics acting on a population that is mostly safe-direction, and each is a claim the subsystem has to support rather than a property of the instrument.
The valve fails its target on the calendar
With an annual full stroke test:
PFDvalve = λDU × T / 2 = 12 × 10⁻⁶ × 8,760 / 2 = 12 × 10⁻⁶ × 4,380 = 5.3 × 10⁻²
The SIL 2 band tops out at 10⁻², so the final element misses its target by a factor of 5.3 before the sensors, the logic solver, the wiring, the actuator air supply or the common-cause contribution have been considered at all. Expressed as risk reduction, 1/5.3 × 10⁻² = 19, against the 100 the band's lower edge requires.
Ask the obvious question. What test interval would fix it?
T = 2 × 10⁻² / (12 × 10⁻⁶) = 1,667 h
about ten weeks, and only to reach the edge of the band; a defensible mid-band 3 × 10⁻³ would need 500 hours, roughly three weeks. A full stroke means closing the valve, which means stopping the train, and a plant that stops its compressor seventeen times a year to prove its trip has solved the safety problem by abolishing the production. The test interval is the right lever and the plant cannot pull it, which is the entire reason partial stroke testing exists.
Partial stroke: the same lever, applied differently
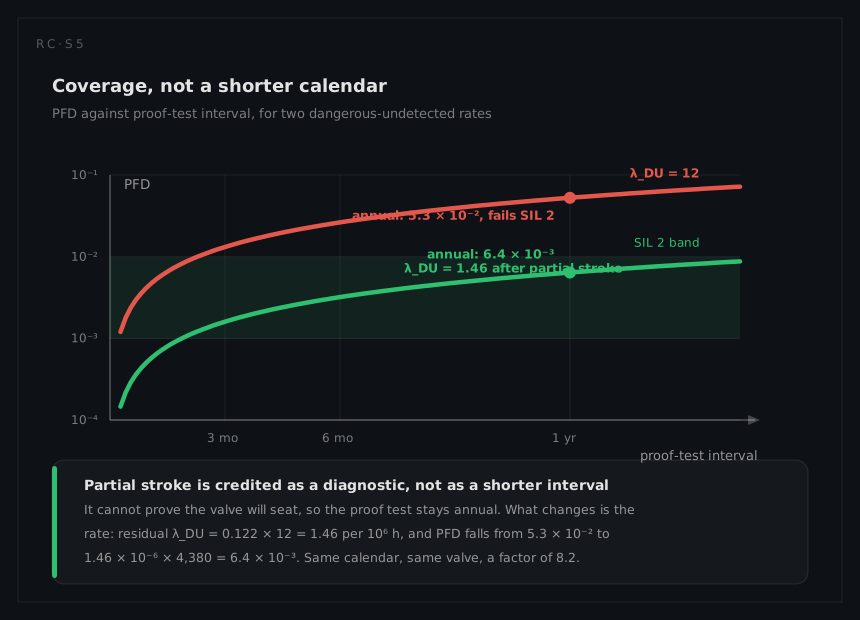
A partial stroke moves the valve a few per cent of its travel while the train keeps running, revealing the modes that stop a valve moving at all: a seized stem, a lost air supply, a failed solenoid, a packing gland gone solid. It does not reveal everything, so it is credited as an automatic diagnostic with a coverage rather than as a shorter interval, converting part of the undetected dangerous rate into a detected one.
Quarterly partial stroke is credited with 88 per cent coverage of the valve's dangerous undetected population, which converts most of it:
λDU(residual) = (1 − C) × λDU = 0.12 × 12 = 1.44 per 10⁶ h
PFDvalve = 1.44 × 10⁻⁶ × 4,380 = 6.3 × 10⁻³
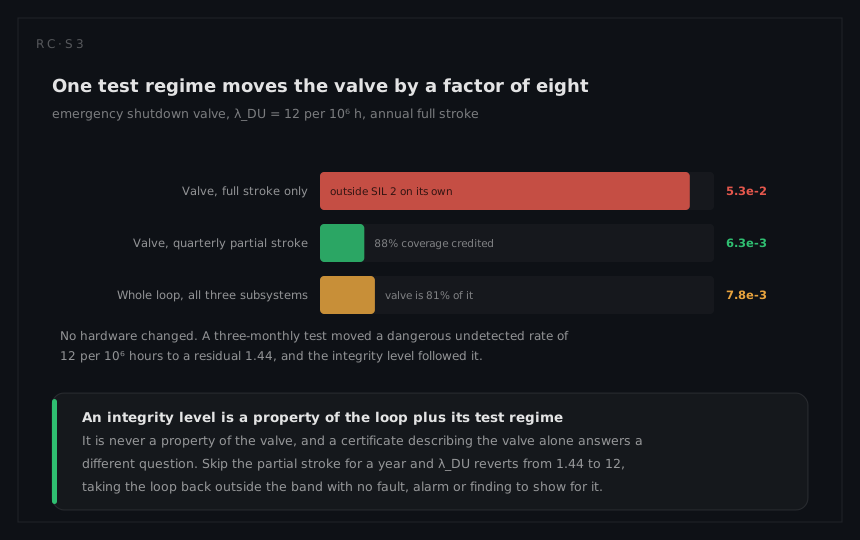
Risk reduction 1/6.3 × 10⁻³ = 159, comfortably inside the SIL 2 band, achieved by a factor of eight improvement without changing a single piece of hardware. The integrity level is a property of the loop plus its test regime. It is never a property of the valve, and a certificate that describes the valve alone is answering a different question.
The loop is not the valve
Everything above is a valve calculation, and a safety integrity level is claimed for a function rather than for a device. IEC 61511 verifies the function by summing the subsystems that implement it:
PFDloop = PFDsensors + PFDlogic + PFDfinal
The final element supplies the 6.3 × 10⁻³ already worked. The other two terms are small on this loop, and writing them out is not bookkeeping. A loop PFD with no sensor term and no logic-solver term cannot be checked by anybody, because there is no way to tell from the result whether those terms were evaluated and found negligible or never evaluated at all. The claim made above, that the valve misses its target before the sensors, the logic solver and the common-cause contribution have been considered, is only worth making if the considering then happens.
Take the sensor group first. Each vibration channel carries 200 per 10⁶ hours, and nearly all of that population fails in the safe direction: it is the same population that produces the 5.3 spurious trips a year computed below when the channels are not voted. The 2oo3 cross-comparison then catches most of what is left, because three channels that ought to agree diagnose each other continuously. Two factors take the channel from its total rate to the rate that matters, and both belong in the safety requirements specification rather than in a footnote:
λD = (1 − 0.95) × 200 = 10 per 10⁶ h
λDU = (1 − DC) × λD = (1 − 0.80) × 10 = 2 per 10⁶ h
A safe fraction of 95 per cent and a diagnostic coverage of 80 per cent. Their product is the one per cent of the channel's rate that reaches the calculation, and it is worth noticing that the same one per cent can be reached from very different pairs: a channel that failed safe only 80 per cent of the time but was diagnosed at 95 per cent would give the same λDU and a materially different spurious-trip rate. The pair is the engineering; the product alone is not enough to reconstruct it, which is why both numbers are stated here rather than the 1 per cent they multiply to.
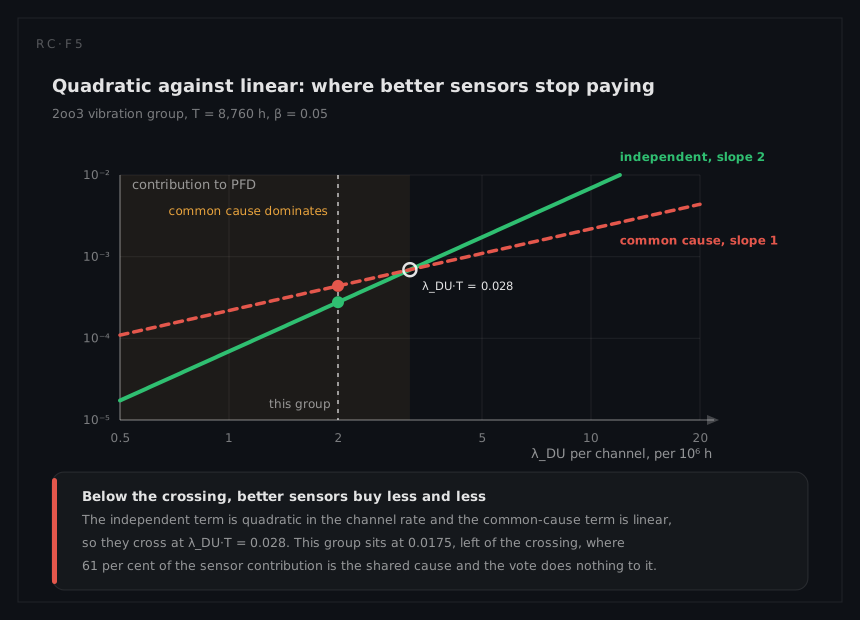
A 2oo3 group is unavailable when any two of its three channels are dead. Each channel's unavailability grows as λDU t between proof tests, so the probability that at least two have failed is approximately 3(λDU t)², and averaging that over the annual interval gives (λDU T)². The channels are independent only in the share the beta factor leaves them, so the independent term runs on the rate (1 − β) λDU:
λDU × T = 2 × 10⁻⁶ × 8,760 = 1.752 × 10⁻²
PFDindependent = ((1 − β) λDU T)² = (0.95 × 1.752 × 10⁻²)² = (1.664 × 10⁻²)² = 2.77 × 10⁻⁴
The beta share is not voted on. A cause that reaches all three channels at once (one calibration procedure applied to three identical transmitters in one shift, a shared junction box, a process condition that saturates every accelerometer) leaves the group behaving as a single channel, so that share carries the 1oo1 form:
PFDCC = β × λDU × T / 2 = 0.05 × 2 × 10⁻⁶ × 4,380 = 4.38 × 10⁻⁴
PFDsensors = 2.77 × 10⁻⁴ + 4.38 × 10⁻⁴ = 7.2 × 10⁻⁴
The common-cause term is 61 per cent of the voted group, and the vote does nothing whatever to it. Quantified with no beta term at all the group reads (λDU T)² = 3.07 × 10⁻⁴, a factor of 2.3 optimistic, and that omission is the standard way a 2oo3 arrangement is oversold; the diesel pair, which carries the same β = 0.05, is this chapter's long-form treatment of why. The two terms also scale differently, which decides where sensor money goes. The independent part is quadratic in λDU and the common-cause part is linear, so they cross at λDU T = β / (2(1 − β)²) = 0.028 and this group sits below the crossover at 0.0175. Halve the channel rate to 1 per 10⁶ hours and the independent part falls to 6.9 × 10⁻⁵ while the common-cause part only falls to 2.19 × 10⁻⁴: the group improves by a factor of 2.5 rather than 4, and 76 per cent of what remains is the shared cause. Better transmitters run into the ceiling every redundant architecture runs into.
The logic solver, and what the sum says
The trip logic solver is the opposite case: a larger rate that costs almost nothing, and the reason is worth making explicit because it is the argument for spending on diagnostics rather than on hardware. Of its 30 per 10⁶ hours, half is dangerous, 15 per 10⁶ hours, and the internal diagnostics and the watchdog announce 99 per cent of that, leaving λDD at 14.85 and λDU at 0.15 per 10⁶ hours. Detected failures are repaired inside the site's restoration time, six hours on this train; only the undetected ones wait for the proof test:
PFDlogic = λDU × T/2 + λDD × MTTR = 0.15 × 10⁻⁶ × 4,380 + 14.85 × 10⁻⁶ × 6 = 6.57 × 10⁻⁴ + 8.9 × 10⁻⁵ = 7.5 × 10⁻⁴
The one per cent the diagnostics miss carries 6.57 × 10⁻⁴ of that total and the ninety-nine per cent they catch carries 8.9 × 10⁻⁵. Turn the diagnostics off and the same solver contributes 15 × 10⁻⁶ × 4,380 = 6.6 × 10⁻², ten times the valve's term and outside SIL 2 on its own. The solver's dangerous rate of 15 per 10⁶ hours is a quarter larger than the valve's 12 and it contributes 8.5 times less. The difference between them is not the failure rate; it is that one is watched continuously and the other is watched once a year.
Summing the three subsystems:
PFDloop = 7.2 × 10⁻⁴ + 7.5 × 10⁻⁴ + 6.3 × 10⁻³ = 7.8 × 10⁻³
| Subsystem | Contribution | Share of the loop |
|---|---|---|
| Vibration sensors, 2oo3 including common cause | 7.2 × 10⁻⁴ | 9 per cent |
| Trip logic solver | 7.5 × 10⁻⁴ | 10 per cent |
| ESD valve with partial stroke credit | 6.3 × 10⁻³ | 81 per cent |
| Loop | 7.8 × 10⁻³ | 100 per cent |
Still inside SIL 2, at a risk reduction of 1/7.8 × 10⁻³ = 129 rather than the 159 the final element alone promised, and with the margin to the band's 10⁻² ceiling cut from 1.6 to 1.3. A figure quoted as a loop PFD that is in fact a final-element PFD is a recurring defect in SIL verification, and here it is worth 23 per cent. It does not change the integrity level and it halves the room between the loop and the ceiling of the band, which is exactly the size of error that gets waved through and then spent twice. Any hazardous event rate computed on this page from 6.3 × 10⁻³ rises by the same 23 per cent when the loop figure is used in its place. Three subsystems is the standard's decomposition and not a complete inventory: the field wiring, the trip amplifier and the actuator air supply have been folded into the subsystem rates rather than itemised, and folding them in is an assumption to be stated, not a fact.
The other half of the verification is not a probability
A loop that meets its PFD band has satisfied one of two requirements. IEC 61508-2 offers two routes to the architectural constraint: Route 1H sets the minimum fault tolerance from the safe failure fraction and the element type, and is the one worked here, while Route 2H rests on proven-in-use evidence instead. IEC 61511 reaches the same constraint from the claimed integrity level and permits a reduction for field devices justified by prior use. Fault tolerance of N means the subsystem still performs the safety function with N dangerous faults present, so HFT 0 means one dangerous fault is enough to lose it. The constraint exists because a PFD is arithmetic on estimated rates and an architecture is not. A structural property survives the discovery that the rates were optimistic; a probability does not, which is the same reasoning that puts the no-single-failure rule alongside the 10⁻⁹ target on the aircraft elsewhere in this chapter.
| Subsystem | Arrangement | Hardware fault tolerance | What has to carry the constraint |
|---|---|---|---|
| Vibration sensors | three channels, 2oo3 | 1 | the architecture itself |
| Trip logic solver | one programmable solver | 0 | its safe failure fraction |
| ESD valve | one valve and one actuator | 0 | its safe failure fraction |
The constraint applies subsystem by subsystem, and that is the part most often missed. The sensor group's fault tolerance does not compensate for the valve's, and the loop is not entitled to average them. Two of the three subsystems here have none at all, so for those two the whole architectural argument rests on the safe failure fraction: the share of an element's total rate that either fails to the safe side or is announced by a diagnostic.
SFF = (λS + λDD) / λtotal
Run it on the valve. Before the partial stroke, 12 of its 40 per 10⁶ hours are dangerous and undetected:
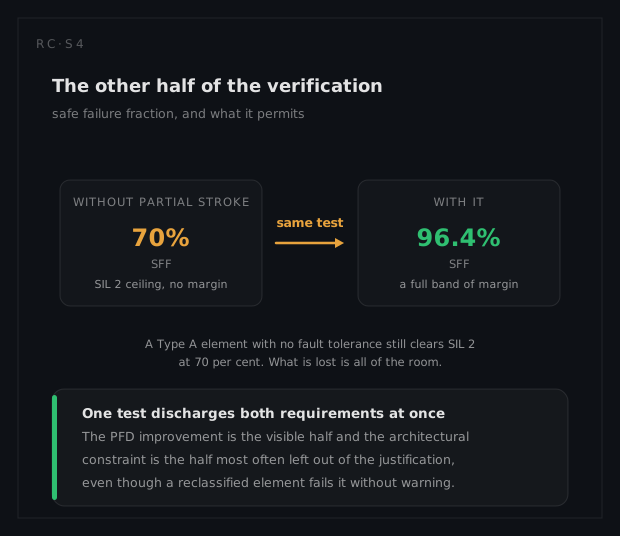
SFF = (40 − 12) / 40 = 28 / 40 = 70 per cent
One caution about that figure. The 28 per 10⁶ hours includes a share found by ordinary maintenance rather than by a diagnostic, and that share cannot be credited to the safe failure fraction, which counts only what fails safe or announces itself. Taking the whole 28 therefore gives an upper bound on SFF rather than an equality, and a subsystem sitting near a band boundary has to split it explicitly.
The partial stroke moves 88 per cent of those 12 into the detected column, leaving the 1.44 per 10⁶ hours backed out above:
SFF = (40 − 1.44) / 40 = 38.56 / 40 = 96.4 per cent
Lose the partial stroke and the valve loses both halves of its case at once: its contribution reverts from 6.3 × 10⁻³ to 5.3 × 10⁻², and its safe failure fraction reverts from 96.4 to 70 per cent. Only the PFD half of the case is actually lost: at 70 per cent a Type A element with no fault tolerance still clears SIL 2 on the architectural side. What goes is the margin. Seventy per cent sits in the lowest band that permits the claim at all, with no room left if the classification is ever challenged. A single three-monthly test discharges both requirements, which is the strongest thing that can be said for it and the thing most often left out of its justification, because the PFD improvement is the visible one and the fraction is not.
The solver's fraction comes out of the same split used above, 15 per 10⁶ hours safe, 14.85 detected, 0.15 undetected:
SFF = (30 − 0.15) / 30 = 29.85 / 30 = 99.5 per cent
Which minimum fault tolerance the standards then demand depends on that fraction and on the element's classification. An element whose failure modes are completely defined and whose field behaviour is backed by dependable data faces a more permissive column than one whose behaviour under fault cannot be fully determined, and anything programmable falls into the second class. A valve and its actuator are normally argued into the first; a programmable logic solver cannot be. That asymmetry is why a single solver at HFT 0 arrives with a certificate quantifying its fraction, while a single valve at HFT 0 is defended with maintenance evidence and, in this sector, with the documented prior-use route IEC 61511 provides for field devices. Both routes are arguments about provenance, which makes the origin of the valve's 40 per 10⁶ hours a functional safety question and not only a reliability prediction one.
One consequence lands on the vote. The sensor group is the only subsystem on this loop with any fault tolerance, and it was not bought for that: it was bought to stop spurious trips, and HFT 1 is a by-product. The degraded configurations differ on this axis as well as on the spurious one. Voting a failed channel out leaves 1oo2, which still tolerates one dangerous fault; leaving it in makes 2oo2, where either surviving channel failing dangerously loses the trip and the group drops to HFT 0. The same configuration choice therefore moves the architectural constraint and not only the trip statistics, and only one of those two effects normally reaches the change request. The spurious side of the trade is worked below.
Two operational consequences that are easy to lose
The first is that the SIL 2 claim now rests on two schedules at once, and is linear in both. Skip the quarterly partial stroke for a year and λDU reverts from 1.44 to 12, taking the loop back to 5.3 × 10⁻². Stretch the full stroke from twelve months to twenty-four to fit the turnaround cycle and the PFD doubles to 1.3 × 10⁻², out of band again. Neither event produces a fault, an alarm or a finding. An engineering assumption has become an operating requirement, and it must be written down as one, tracked as one, and raised through FRACAS when a test is missed or a stroke comes back slow.
The second is the vote, which encodes a trade rather than an improvement. Three vibration sensors at 200 per 10⁶ hours each, arranged so that any one could trip, would produce
3 × 200 × 10⁻⁶ × 8,760 = 5.3 spurious trips a year
on instrumentation alone, on a machine whose unplanned stop is enormously expensive. The 2oo3 vote removes essentially all of that, and the price is that one dangerous sensor failure consumes its margin. The degraded behaviour is then a configuration choice: vote the failed channel out and the arrangement becomes 1oo2, more likely to trip spuriously and less likely to fail to trip; leave it in and it becomes 2oo2, the reverse. A setting in a logic solver now carries part of the integrity argument.
The demand rate is half the answer, and it is not constant
A PFD on its own is not a hazard rate. The hazardous event rate is the demand rate multiplied by the probability the function fails on demand, and this machine's demand rate rises with age, because the hot section is a strong wear-out item:
h(t) = (β/η)(t/η)^(β−1) = (3.1 / 52,000) × (t / 52,000)^2.1
At the age-replacement optimum of 28,600 hours that is 5.96 × 10⁻⁵ × 0.2849 = 1.70 × 10⁻⁵ per hour, 17.0 per 10⁶ hours. Run the section to its characteristic life of 52,000 hours, where the ratio is 1, and the hazard is 5.96 × 10⁻⁵ per hour, 59.6 per 10⁶ hours, three and a half times higher. Insofar as hot-section events demand the trip, the hazardous event rate moves with them:
at 28,600 h: 17.0 × 10⁻⁶ × 6.3 × 10⁻³ = 1.07 × 10⁻⁷ per hour, 9.4 × 10⁻⁴ per year
at 52,000 h: 59.6 × 10⁻⁶ × 6.3 × 10⁻³ = 3.76 × 10⁻⁷ per hour, 3.3 × 10⁻³ per year
Deferring the hot-section replacement multiplies the hazardous event rate by 3.5 without anyone touching the safety instrumented function, and the deferral is normally argued on production grounds by people who have never seen the PFD. The decision behind the 28,600 hours is worked on the reliability page.
What the analysis tells the engineer to do
Put the twelve-month full stroke and the three-month partial stroke into the operating procedure as safety requirements with named owners, and treat a missed test as a hazard-log entry rather than a maintenance backlog item.
Spend on the final element, not on the sensors. The logic solver's 30 per 10⁶ hours is a larger number than the valve's 12 and contributes far less, because it is continuously operating and diagnosed while the valve is dormant. A loop analysis that follows the biggest λ spends its effort in the wrong place.
Carry the sensor group's beta factor as a named input with the measures that justify it attached: separate cable routes, three transmitters never calibrated by one person in one shift, and a periodic check that the three channels still disagree by less than the alarm threshold. Sixty-one per cent of the sensor subsystem's contribution is that single parameter, no amount of voting touches it, and it is the one number on the loop with no test behind it.
Bring the hot-section replacement age into the safety conversation: it is currently a cost optimisation and it is also a demand-rate control.
Verify the 88 per cent partial-stroke coverage against the valve's actual failure modes rather than accepting a supplier figure, because the SIL 2 claim is one subtraction away from it. Where such figures come from is the subject of reliability prediction and of the testability column.
Label every quoted probability with the subsystem it belongs to, and record the fault-tolerance argument next to it. A figure that travels between documents without that label will be read as whichever of the two flatters the argument in front of it. The same applies to the architectural side: which subsystem carries which hardware fault tolerance, what safe failure fraction each single-element subsystem claims, and on what basis its failure behaviour was classified are three statements that belong in the safety requirements specification, because a change of valve, actuator or solver invalidates them without touching a single failure rate.
What a different technique would have given
Treat the valve like the rest of the train and the answer changes beyond recognition. An availability model takes the valve's 40 per 10⁶ hours, pairs it with a repair time near the lube system's six hours, and reports an unavailability of
40 × 10⁻⁶ × 6 = 2.4 × 10⁻⁴
The properly tested final element is 26 times that figure at 6.3 × 10⁻³, and the verified loop 33 times it at 7.8 × 10⁻³, so the availability reading is optimistic by more than an order of magnitude. The arithmetic is impeccable and it describes a valve that is repaired promptly when it breaks, which is not this valve. The same model quotes an MTBF of 1/40 × 10⁻⁶ = 25,000 hours, about three years, a figure that sounds reassuring and is irrelevant, because the valve is not accumulating operating time. It is sitting.
A layer of protection analysis fails more gently. It would identify the initiating event, credit the trip and the relief and containment layers around it, and arrive at a required risk reduction, which is a target rather than a demonstration. It would tell the site that a SIL 2 function is needed. It would not tell them that the one they have sits at 5.3 × 10⁻² until somebody works the interval, and the interval is the only part of this system that turns out to be adjustable.