

A gas turbine driver, a centrifugal compressor, a lube oil system with a duty and a standby pump, three vibration sensors voted two out of three, and an emergency shutdown trip with its valve. Continuous duty, 8,760 hours a year, and a turnaround every four years. This train contains two named unplanned corrective actions whose durations differ by a factor of nearly sixty: six hours on the lube system, three hundred and forty on the turbine hot section.
That spread is the lesson. Everything the standard maintainability apparatus does well assumes a repair-time population with one centre and a tail. This one has two centres several days apart, and every summary computed across both describes an event that never happens.
The technique, and why this one
A two-component mixture of lognormals, with the failure-rate-weighted roll-up computed first so that it can be shown to fail. The roll-up is not skipped: it is the standard system-level composition and it has to be done before anyone can see why it does not answer the question here. What replaces it is a mixture whose weights are the branch probabilities and whose components are the two physically distinct jobs.
| Item | Model for the repair time | Model for the weight | Value |
|---|---|---|---|
| Lube oil system, 2 pumps fitted | lognormal, σ = 0.7 | exponential, λ = 500 per 10⁶ h each | R̂ = 6 h |
| Turbine hot section | lognormal, σ = 0.7 | Weibull, β = 3.1, η = 52,000 h | R̂ = 340 h |
| Combined unplanned population | two-component mixture | branch probabilities from the rates | see below |
| Hot-section placement | calendar placement into a booked window | 21-day turnaround every 4 years | |
| ESD valve proof test | partial stroke, 3-monthly | access constrained by production |
The Weibull in the weight column makes this page different from every other roll-up in the chapter. The rate that weights a repair time is a reliability output, and if that output used the wrong distribution the maintainability answer inherits the error whatever the repair times are.
The roll-up, and the number it produces
Start conventionally, with the design-stage book rates and the failure-rate-weighted roll-up:
MTTRsys = Σ(λᵢ · R̂ᵢ) / Σλᵢ
| Unplanned action | λ per 10⁶ h | R̂ᵢ (h) | λᵢ × R̂ᵢ | Share of expected repair hours |
|---|---|---|---|---|
| Lube oil system (2 pumps fitted) | 1,000 | 6 | 6,000 | 4.8% |
| Turbine hot section | 350 | 340 | 119,000 | 95.2% |
| Partial roll-up | 1,350 | 125,000 | 100% |
MTTR = 125,000 / 1,350 = 92.6 h
Ninety-five per cent of expected repair hours belong to an action that accounts for a quarter of the events. The arithmetic is correct, the number is useless, and quoting it in a specification would commit the programme to a duration no job on this train will ever produce.
The mixture the mean is hiding
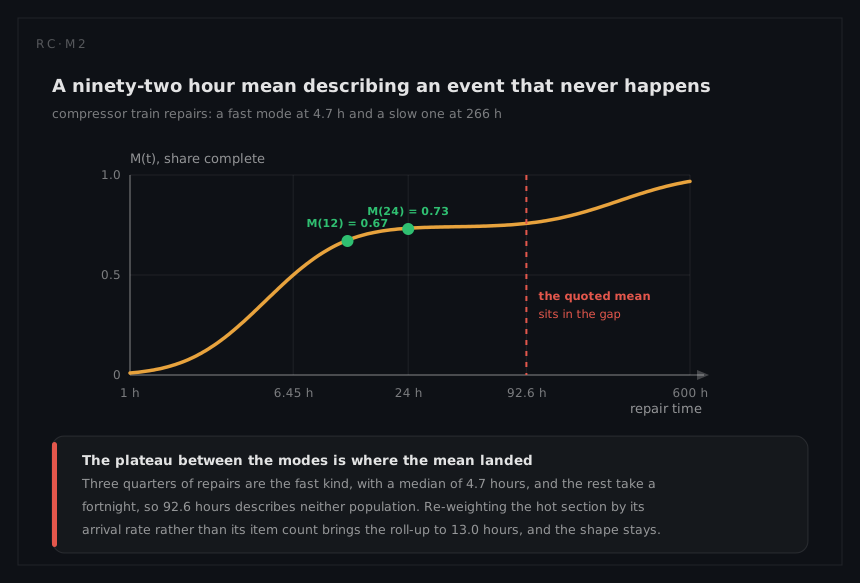
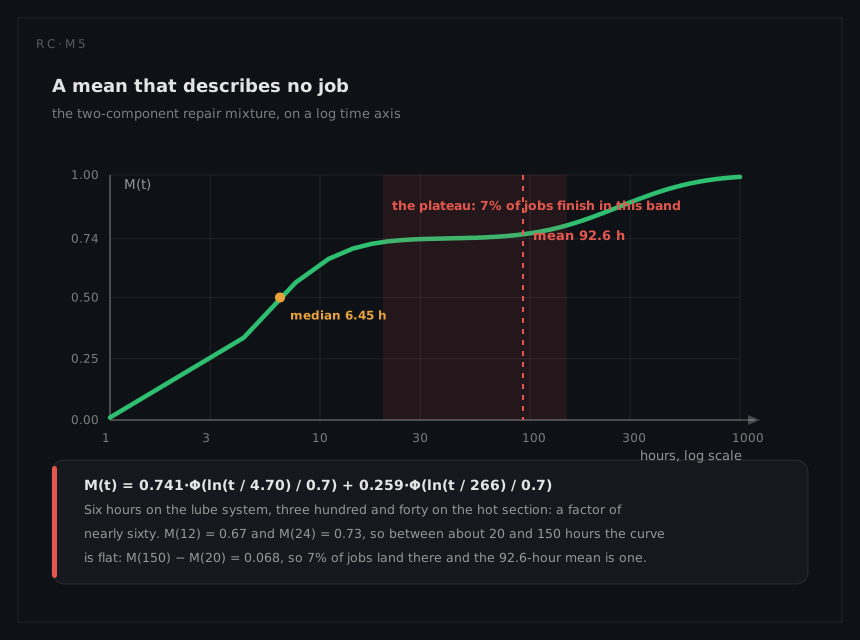
Write the population properly. The branch probabilities are the rate shares, 1,000 / 1,350 = 0.741 and 350 / 1,350 = 0.259, and each branch is a lognormal about its own median:
tmed(lube) = 6 / e^0.245 = 4.70 h tmed(hot) = 340 / e^0.245 = 266 h
M(t) = 0.741 · Φ(ln(t / 4.70) / 0.7) + 0.259 · Φ(ln(t / 266) / 0.7)
M(12) = 0.741 × 0.910 + 0.259 × 0 = 0.67
M(24) = 0.741 × 0.990 + 0.259 × 0.0003 = 0.73
Two thirds of unplanned corrective actions finish within twelve hours and nearly three quarters within a day, against a quoted mean of 92.6 hours. The mixture's median sits where the lube branch reaches 0.5 / 0.741 = 0.675 of its own distribution:
t₀.50 = 4.70 × e^(0.454 × 0.7) = 4.70 × 1.374 = 6.45 h
A mean of 92.6 hours and a median of 6.45 hours, a factor of fourteen apart. When a population splits this hard the honest report is two durations and their frequencies, never one average of them.
The weight was wrong as well
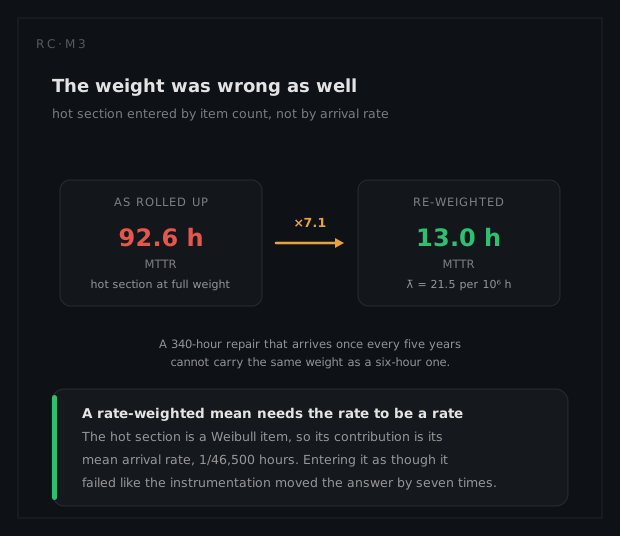
The roll-up used the hot section's design-stage constant of 350 per 10⁶ hours. The reliability page refuses that figure, because with β = 3.1 the hot section is an ageing item whose average rate is
λ̄ = 1 / (η · Γ(1 + 1/β)) = 1 / (52,000 × 0.8943) = 1 / 46,500 = 21.5 per 10⁶ h
Recompute the roll-up with the fitted weight:
| Unplanned action | λ per 10⁶ h | R̂ᵢ (h) | λᵢ × R̂ᵢ |
|---|---|---|---|
| Lube oil system | 1,000 | 6 | 6,000 |
| Turbine hot section | 21.5 | 340 | 7,310 |
| Roll-up | 1,021.5 | 13,310 |
MTTR = 13,310 / 1,021.5 = 13.0 h
The same repair times, the same formula, a different distribution on one input, and the system mean moves from 92.6 hours to 13.0. In annual repair hours the correction is starker: the constant rate implies 350 × 10⁻⁶ × 8,760 = 3.07 hot-section events a year and 1,042 hours of work, while the Weibull average implies 0.188 events a year, one every 5.3 years, and 64 hours. A factor of sixteen in the maintenance labour budget, decided by a shape parameter that belongs to somebody else's analysis.
The bimodality survives the correction and worsens. With the hot section now carrying 2.1% of events, the mixture's 90th percentile falls wholly inside the lube branch at 12.5 hours while its 99th falls inside the hot branch at 277 hours: two adjacent percentiles of the same distribution, a factor of twenty-two apart.
Placement, not duration
Three hundred and forty hours is 14.2 days. No operating window absorbs it and the 21-day turnaround absorbs it comfortably, so the maintainability question stops being how long and becomes when. The planned turnaround costs 21 / (4 × 365) = 1.44% of calendar time, which is why an inherent availability of 0.9926 becomes an operational production availability of 0.9926 × 0.98562 = 0.978. Planned maintenance is not free maintenance; it is pre-paid maintenance, and 1.44% is the receipt.
Condition monitoring makes the placement possible, detecting 88% of the production-affecting failure rate on a hot section whose β = 3.1 gives it rising, observable degradation. It does not shorten the 340 hours by a minute; it moves them from a date the machine chooses to a date the planner chooses, which on this train is worth more than any reduction in work content.
The placement is not quite free. The age-replacement optimum on the reliability page sits near 0.55η, about 28,600 hours or 3.26 years of running, while the turnaround arrives at 35,040 hours. Snapping the exchange to the window runs the hot section 6,440 hours past its optimum, which the shallow cost curve there makes affordable. That trade, between the theoretically right date and the only available one, is the RCM argument in adult form.
The repair time that never enters the answer
The lube pair reaches the same objective through architecture. Two pumps with one running means the 6-hour repair happens on a train that is still producing, so its duration never enters the production availability arithmetic. It is still real work: at 1,000 per 10⁶ hours the pair generates 8.76 events a year and 52.6 hours of labour, comparable with the hot section's 64 hours and arriving in far smaller pieces. Both belong in the staffing plan; only one belongs in the availability model. One ledger sizes a crew, the other sizes a production forecast.
The shutdown loop shows a third variant. A full proof test of the valve requires the train to stop, so the regime was designed around the access window instead: partial stroke testing every three months, bringing the valve to 6.3 × 10⁻³ and the loop PFD to 7.8 × 10⁻³, inside the SIL 2 band without a production outage. The safety page sets the interval; that it can be set at all is a maintainability decision about what can be done to a running machine.
What a different technique would have given
The alternative worth taking seriously is a single lognormal fitted to the pooled unplanned work orders, which is what a maintenance management system produces by default. Matched to the corrected mixture's mean of 13.0 hours and median of 4.79, that fit needs
σ = √(2 · ln(13.03 / 4.79)) = √(2 × 1.002) = 1.42
and a σ of 1.42 against the discipline's habitual 0.7 is itself the diagnostic: a shape parameter that large almost always means several populations have been added together. The fit then misses in both directions. Its 90th percentile is 4.79 × e^(1.282 × 1.42) = 29.4 hours against the mixture's 12.5, so it over-provisions for the routine job; its 99th is 4.79 × e^(2.326 × 1.42) = 129 hours against the mixture's 277, so it under-provisions by more than half for the only job that needs a turnaround booked around it. A single distribution stretched across a bimodal population is not a compromise between the two answers; it is wrong at both of them, and the second error would cost a season of production.