

A gas turbine driver, a centrifugal compressor, a lube oil system with a duty and a standby pump, three vibration sensors voted two out of three, and a 2oo3 emergency shutdown trip with its own valve. The machine runs continuously and exists to move product, so for this owner availability is not a percentage of clock time: it is gas compressed against gas that could have been compressed, and every hour on the ledger has a price attached to it.
The largest single block of that loss is not a failure. It is written into the plan years in advance, it is 504 hours long, and most availability dashboards in the industry would exclude it as a footnote. Putting it back on the ledger changes the reported availability of this train by more than any engineering intervention available to its designers.
The technique, and why this one
Production availability accounting, in which the unplanned and planned ledgers are computed separately and combined multiplicatively, with a Markov state model for the repairable duty-and-standby pump pair and Weibull age-replacement arithmetic for the hot section. One technique cannot cover this train. The unplanned ledger is a straightforward rate-times-downtime roll-up. The planned ledger is a schedule, not a distribution, and belongs in the product rather than in the sum. The pump pair is repairable redundancy where whether the standby is available depends on whether a previous repair has finished, which is a question about transitions and not about structure. And the hot section wears out, so its contribution to downtime depends on a maintenance policy rather than on a rate.
| Item | Availability model | Parameters |
|---|---|---|
| Turbine hot section | Weibull with age replacement | β = 3.1, η = 52,000 h; unplanned repair 340 h; replacement age 28,600 h |
| Lube oil pump (2 fitted, 1 running) | Markov, repairable pair | λ = 500 per 10⁶ h each, μ = 1/6 h⁻¹ (6-hour repair) |
| Vibration sensor (3 fitted) | exponential, 2oo3 voted | λ = 200 per 10⁶ h each |
| ESD shutdown valve | dormant, proof tested | λ = 40 per 10⁶ h, dangerous undetected 12 per 10⁶ h |
| Trip logic solver | exponential | λ = 30 per 10⁶ h |
| Train, production-affecting | series roll-up | 1,180 per 10⁶ h |
| Turnaround | schedule, not a distribution | 21 days every 4 years |
The unplanned ledger
Inherent production availability is Ai = 0.9926, an unavailability of 7.4 × 10⁻³, which on a continuous year is
unplanned downtime = 7.4 × 10⁻³ × 8,760 = 64.8 hours a year
The train produces production-affecting failures at 1,180 per 10⁶ hours, so
events = 1,180 × 10⁻⁶ × 8,760 = 10.3 a year
and the implied rate-weighted mean downtime is
MDT = 64.8 / 10.3 = 6.3 hours per event
which is close to the six-hour lube system repair, as it should be: most of the train's events are small, and the arithmetic is self-consistent. That single figure is also the reason the hot section cannot be modelled the same way as everything else. An unplanned hot-section repair takes 340 hours, fifty-four times the train's average event, and one of them in a year would consume 3.9% of the calendar against an annual loss budget of 2.2%.
The hot section, and what age replacement buys
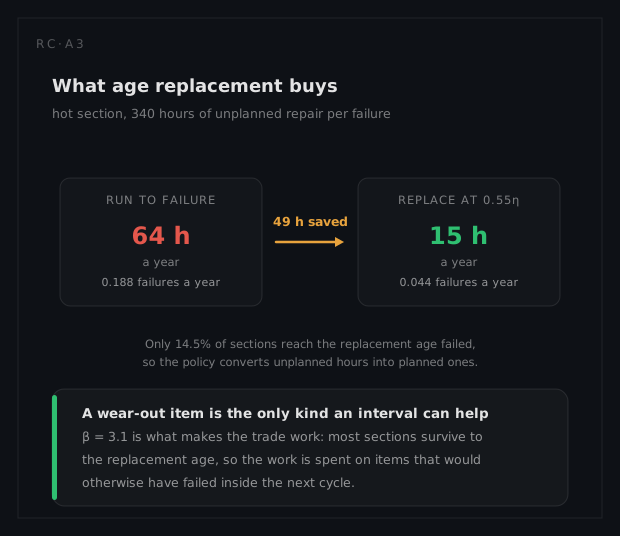
With β = 3.1 the hot section is a textbook ageing item, and its availability contribution depends entirely on whether it is replaced before it fails. Run to failure, its mean life is
MTTF = η · Γ(1 + 1/β) = 52,000 × 0.8943 = 46,500 h
failures per year = 8,760 / 46,500 = 0.188
downtime per year = 0.188 × 340 = 64 hours
which would roughly double the train's entire unplanned loss from one item. Replace it instead at the cost-optimal age of 28,600 hours (0.55η, the optimum the reliability page derives from a failure-to-planned cost ratio of eight), and the probability of failing first is
F(28,600) = 1 − exp(−(28,600 / 52,000)^3.1) = 1 − exp(−(0.55)^3.1) = 1 − exp(−0.157) = 0.145
replacement cycles per year = 8,760 / 28,600 = 0.306
unplanned failures per year = 0.145 × 0.306 = 0.044
downtime per year = 0.044 × 340 = 15 hours
Taking the cycle length as the full replacement age is slightly conservative, since a unit that fails early is renewed early, but the conclusion is not sensitive to it. Age replacement removes about 49 hours a year from a 64.8-hour unplanned budget: three quarters of the train's unscheduled downtime is bought back by a maintenance policy rather than by a component. Without it the train's inherent availability would sit near 0.987 rather than 0.9926, and no exponential model of the hot section can produce that result, because an exponential item gains nothing from being replaced early.
The pump pair needs a state model
Two lube oil pumps, one running and one on standby, both repairable in six hours. A reliability block diagram would call this an active parallel pair and multiply unavailabilities. It would be wrong, because repair couples the states: whether the standby is there when the duty pump fails depends on whether an earlier repair has completed, and that is a transition question. The Markov model has three states (both available, one failed and under repair, both failed) with a single repair channel, and everything is governed by one ratio:
λ/μ = 500 × 10⁻⁶ / (1/6) = 3.0 × 10⁻³
For a true cold standby, where the idle pump cannot fail, the steady-state probability of the both-failed state is
q = (λ/μ)² / (1 + λ/μ + (λ/μ)²) = 9.0 × 10⁻⁶ / 1.003 = 9.0 × 10⁻⁶
For a hot standby, where both pumps are exposed, it doubles:
q = 2(λ/μ)² / (1 + 2λ/μ) = 1.8 × 10⁻⁵ / 1.006 = 1.8 × 10⁻⁵
The train's model carries 1.1 × 10⁻⁵, between the two, because the standby pump is kept barred and warm rather than genuinely cold: it accumulates a fraction of the running rate while it waits, and the changeover is not instantaneous. In hours that is
1.1 × 10⁻⁵ × 8,760 = 5.8 minutes a year
against the train's 64.8 hours, so the pumps are 0.15% of the unplanned loss and are not the problem. What the state model exposes, and what no static structure shows, is the sensitivity: q goes as the square of λ/μ, so halving the six-hour repair to three hours cuts the pump pair's contribution by a factor of four. Repair speed is a quadratic lever on a repairable pair, and it is the only place on this train where maintainability buys availability faster than reliability does. The arithmetic also hides a caveat the design must not: all of it assumes the standby actually starts, fast enough to hold oil pressure above the trip threshold, and that somebody knew it was healthy beforehand. An unexercised standby is a single pump wearing a redundancy diagram.
Putting the two ledgers together
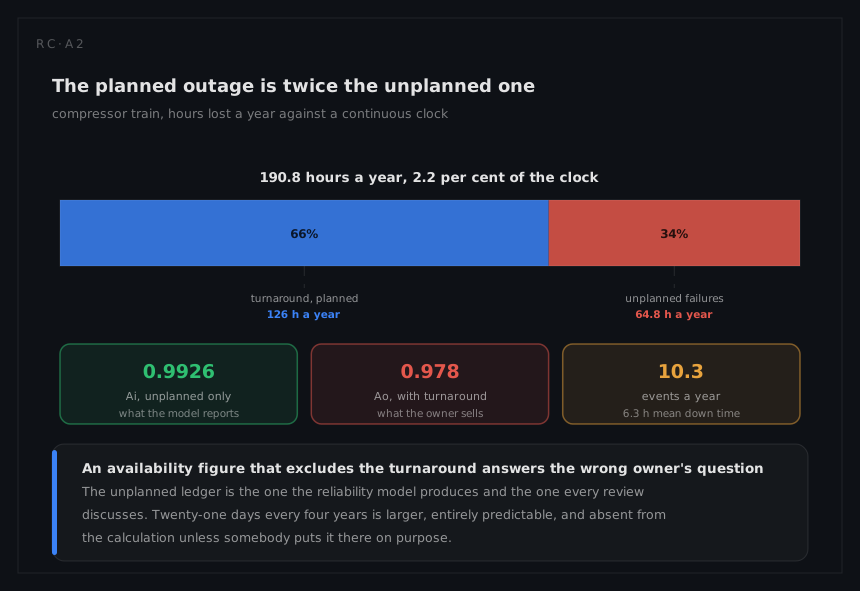
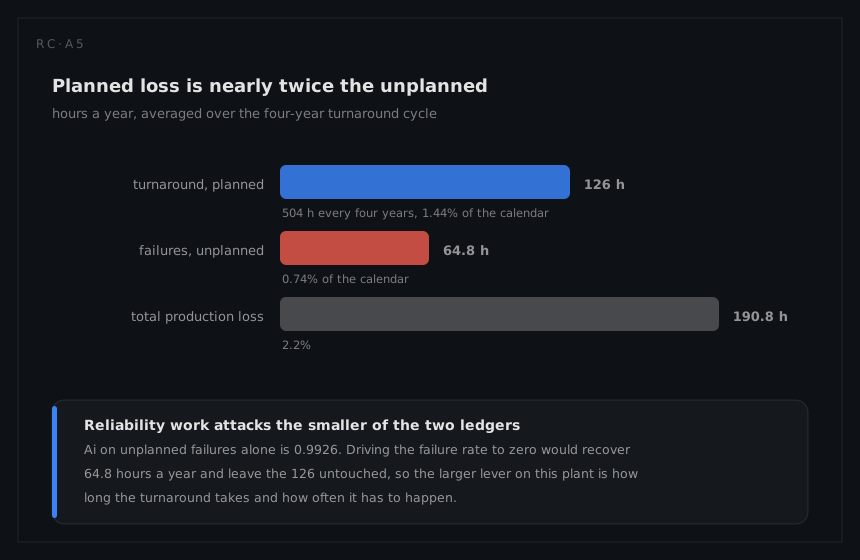
The turnaround is 21 days every four years:
planned downtime = 21 × 24 = 504 h every 4 years = 126 hours a year
planned unavailability = 126 / 8,760 = 1.44%
The two ledgers combine as a product, because a train cannot be broken and shut down at the same time:
Ao = Ai × (1 − 0.0144) = 0.9926 × 0.9856 = 0.978
total loss = 64.8 + 126 = 190.8 hours a year = 2.2%
Put those side by side and the finding is uncomfortable for most reporting practice. Planned downtime is nearly twice the unplanned kind, 126 hours against 64.8, so a dashboard that tracks only unscheduled events is describing about a third of the actual loss while presenting itself as the availability report. Planned outage belongs on the ledger as a line, not in the exclusions as a footnote, and the systems chapter makes the general case: a budget that only tracks unscheduled downtime hands the schedulers an unlimited account.
The second availability, in a different currency
The emergency shutdown function is dormant, and its availability is a probability of working on demand rather than a fraction of time. Proof testing the shutdown valve annually gives
PFD = λDU × T / 2 = 12 × 10⁻⁶ × 8,760 / 2 = 5.3 × 10⁻²
for the valve alone, which fails its SIL 2 target on its own. Partial stroke testing every three months raises effective coverage and brings the valve to 6.3 × 10⁻³ and the loop to 7.8 × 10⁻³, inside the band. The availability point is what full stroke testing would cost: a genuine trip of the machine, which is production downtime spent to buy protection availability. Partial stroke testing exists precisely to break that trade, and the safety page works the integrity argument behind it. These two availabilities cannot be added: one is hours of gas not compressed, the other is a probability on a demand that may never come.
What the analysis tells the engineer to do
Once both ledgers are on the same page they can be traded, and that is the whole business case for condition monitoring on this machine. An unplanned hot-section event costs 340 hours; the same work executed inside the turnaround window costs approximately nothing extra, because the train was going to be stopped anyway. Vibration and lube monitoring detect 88% of production-affecting failure rate, which is RCM's on-condition logic priced in availability currency, and a single avoided surprise repays the instrumentation several times over.
Second, compress the turnaround rather than the repairs, which is planned downtime treated as designed downtime rather than as an exclusion. One day off a 21-day turnaround is six hours a year, which is comparable to the entire lube pump programme and larger than anything the maintainability page can win on the six-hour repair. Third, keep the standby pump exercised, because the Markov result is worth nothing if the state it describes does not exist.
What a different technique would have given
The standard alternative is a single steady-state availability for the whole train with planned outage excluded from the denominator, which is how a large fraction of process plant reports itself. It gives 0.9926 and it is not a lie, exactly: it is the answer to "how available is this train when it is supposed to be running". It was rejected because the owner does not buy running hours, the owner buys compressed gas, and 126 hours a year of that gas is missing from the answer. Reporting 99.26% for a machine that delivers 97.8% is a two-percentage-point error on the only number the asset is judged by.
The narrower alternative, a single reliability block diagram across the whole train, fails for two independent reasons and both are instructive. It cannot represent the repair coupling in the pump pair, so it would replace 1.1 × 10⁻⁵ with a product of unavailabilities and lose the quadratic repair-time sensitivity that is the cheapest improvement on the machine. And it would charge the hot section at a constant rate, which would say that age replacement is pointless. It is not pointless: it is worth 49 hours a year, three quarters of everything unplanned that happens to this train.