

Two engine-driven integrated drive generators, an APU generator, a ram air turbine, two generator control units and three bus tie contactors. The reliability column asks how often this generation chain fails. Availability asks a blunter and more commercial question: can this aeroplane be released to service at six o'clock tomorrow morning, and if not, how many hours will pass before it can? The two questions have different answers, and on this system they have different owners.
The answer also has almost nothing to do with the generators. Everything interesting in the aircraft's availability ledger is decided by where one spare integrated drive generator happens to be sitting, by a dispatch rule negotiated with the certification authority, and by one branch of the system that is dormant and therefore invisible to every uptime record the operator keeps.
The technique, and why this one
An Ai-to-Ao decomposition built on steady-state availability arithmetic, with a Monte Carlo sparing simulation carrying the outstation logistics tail, and a separate λT/2 term for the dormant ram air turbine. Three features of the system force that mix rather than one clean method. The inherent number is a genuine closed form, because the generation chain is a series of independent, exponentially distributed, individually replaceable line-replaceable units, which is exactly the case the product rule was written for. The operational number is not a closed form, because it depends on whether the spare is at the station, whether it is already committed to another tail number, and how long the return leg takes: that is a queue with inventory in it, and queues with inventory are simulated. And the ram air turbine contributes nothing at all to a time-based ledger, because it is never running and its failures are silent.
| Item | Availability model | Parameters |
|---|---|---|
| IDG (2 fitted) | exponential, repairable LRU, Monte Carlo sparing | λ = 250 per 10⁶ FH each; active repair 1.5 h; 26 h added logistics delay at an outstation |
| GCU (2 fitted) | exponential, repairable LRU | λ = 90 per 10⁶ FH each; active repair 0.6 h |
| Bus tie contactor (3 fitted) | exponential, repairable LRU | λ = 25 per 10⁶ FH each; active repair 2.2 h |
| APU generator | exponential, alternative source | λ = 300 per 10⁶ FH |
| Ram air turbine | dormant, periodically tested | λ = 40 per 10⁶ FH; functional check every 500 FH |
| Dispatch allowance | operating rule, not a distribution | one IDG inoperative for up to 3 days |
| Utilisation | denominator | 3,000 flight hours per aircraft-year |
The inherent number, in hours
The generation chain carries 730 per 10⁶ flight hours, which is two identical channels of 365 each (IDG 250 plus GCU 90 plus contactor 25). Mean time between failures is therefore
MTBF = 1 / (730 × 10⁻⁶) = 1,370 FH
Active repair time is not a single value but a failure-rate-weighted average of the three repair times, which is how a mixed population enters a single availability term:
MTTR = Σ(λᵢ·tᵢ) / Σλᵢ = (250 × 1.5 + 90 × 0.6 + 25 × 2.2) / 365 = 484 / 365 = 1.33 h
Ai = MTBF / (MTBF + MTTR) = 1,370 / 1,371.33 = 0.99903
The programme carries Ai = 0.9991, a shade better, because not every generation-chain failure is dispatch-relevant. Take that as the inherent unavailability of 9.0 × 10⁻⁴ and convert it into the only currency an operator argues in:
inherent downtime = 9.0 × 10⁻⁴ × 3,000 FH = 2.7 hours per aircraft-year
Where the other 8.7 hours went
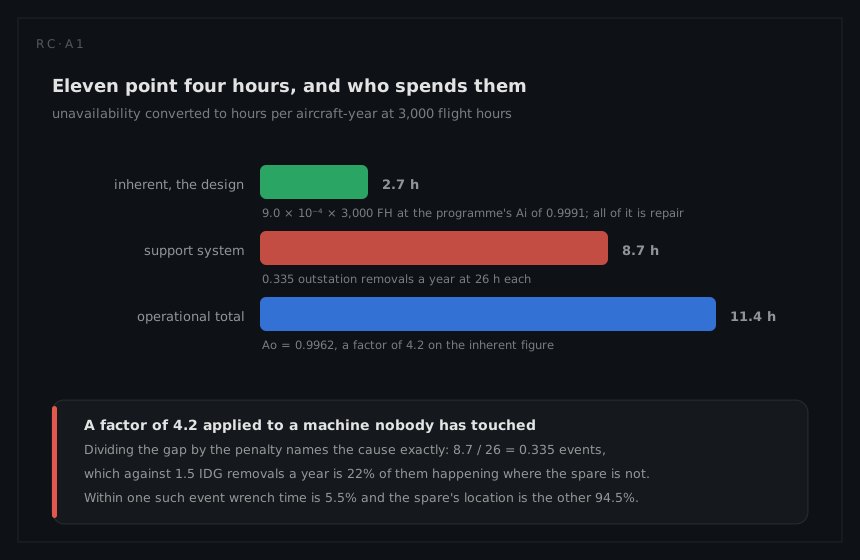
Operational availability is Ao = 0.9962, an unavailability of 3.8 × 10⁻³, which at the same 3,000 flight hours is 11.4 hours per aircraft-year. The design delivers 2.7 of those hours and the support system spends the remaining 8.7, a factor of 4.2 applied to a machine nobody has touched.
The gap can be attributed exactly, and this is the arithmetic worth memorising. The IDG population generates
IDG removals = 2 × 250 × 10⁻⁶ × 3,000 = 1.5 per aircraft-year
and each removal that happens away from the spare adds 26 hours. Dividing the gap by the penalty gives the number of such events:
8.7 h / 26 h = 0.335 outstation removals per aircraft-year
0.335 / 1.5 = 22% of IDG removals
So the whole Ai-to-Ao gap on this aeroplane is one sentence: roughly a fifth of generator removals happen where the spare is not. Within one of those events, 1.5 hours is work and 26 hours is waiting, so wrench time is 5.5% of the event and the spare's location is the other 94.5%. The Ai-to-Ao decomposition exists to make precisely this attribution, and it settles the usual argument before it starts: no achievable improvement in generator failure rate closes a gap that contains almost no repair. The maintainability page owns the 1.5 hours; this page owns the 26.
Why the sparing question needs a simulation
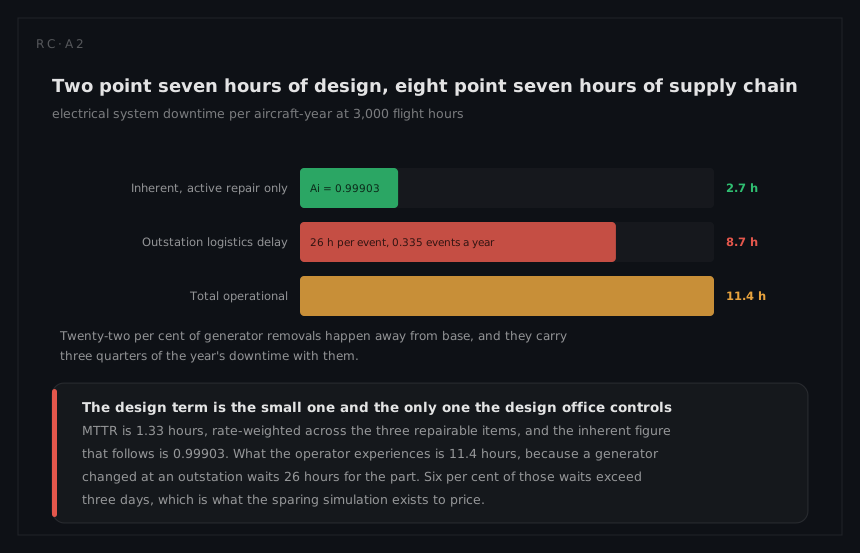
The 26 hours is a mean, and a mean is the one statistic the fleet manager cannot use. Dispatch is permitted with one IDG inoperative for up to three days, so the question that decides whether an availability line becomes a cancelled service is not the average delay but the tail: what fraction of outstation removals exceed 72 hours?
A closed form cannot answer it, because the delay is not a smooth distribution. It is a mixture: zero if a spare is on station, one transport cycle if the base has a free unit, and something much longer if two removals overlap and the single spare is already committed. As an order-of-magnitude check, treating the delay as exponential with a mean of 26 hours gives
P(delay > 72 h) = e^(−72/26) = e^(−2.769) = 6.3%
so about one outstation removal in sixteen breaches the allowance under the crudest possible assumption. The real distribution is lumpier than that, and the simulation exists to produce it: model each aircraft's removals as a Poisson stream at 500 per 10⁶ flight hours, hold a defined stock at each location, route each removal to the nearest free unit, return the failed unit to the repair pipeline, and count the breaches. That is the class of problem the method spec reserves for Monte Carlo, and the rule it obeys is worth stating plainly: do not simulate what you can integrate, and do not integrate what has a spares pool in it.
The branch that never appears in the uptime ledger
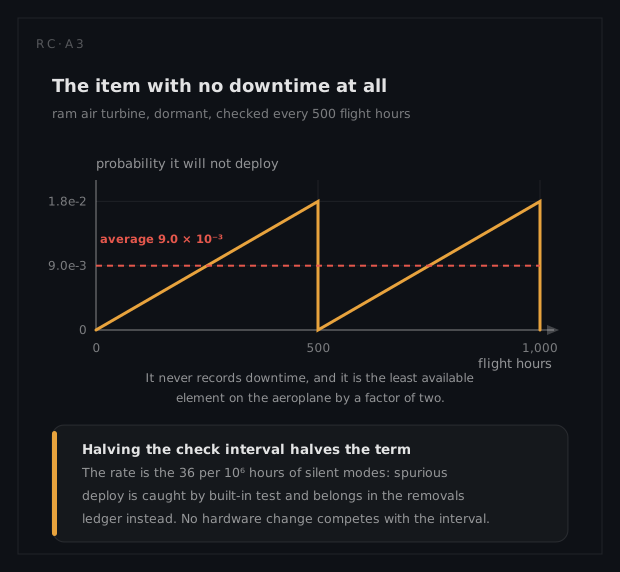
The ram air turbine is dormant. It is never running, so it never records downtime, and every availability dashboard the operator owns will report it as serviceable for its entire life. Its real availability is the probability that it works when the aircraft has lost everything else, and that is governed by the test interval rather than by any repair time:
QRAT = λT / 2 = 36 × 10⁻⁶ × 500 / 2 = 9.0 × 10⁻³
The rate is the turbine's 36 per 10⁶ hours of silent modes and not its whole 40: spurious deploy is caught by continuous built-in test, so it never lies latent between checks and cannot belong in a λT/2 term. It costs dispatch time instead, and it is counted in the removals ledger above rather than here.
Nine parts in a thousand unavailable, against a distributed system reporting 3.8 × 10⁻³. The least available element of the electrical system is the one that has never appeared on an availability report. Halving the functional-check interval to 250 flight hours halves the term to 4.5 × 10⁻³, which is the cheapest availability purchase anywhere on this aeroplane and does not involve buying anything. The testability page works the same interval from the detection side, and the safety page shows why the RAT's contribution matters out of all proportion to its rate.
What the analysis tells the engineer to do
Two numbers decide the spending, and they price the three availability levers against each other on this aeroplane. Forward-positioning one IDG at the busiest outstation attacks 26 hours per event and about 8.7 hours per aircraft-year directly. Halving every failure rate in the generation chain, which is a multi-year engineering programme of derating and requalification, halves both the inherent term and the gap, taking 11.4 hours to 5.7: still worse than the 2.7 hours a properly positioned spare delivers on day one. The support lever wins, and it wins by a margin that no component programme can close.
The dispatch allowance is the second finding, and it deserves its own discipline. Three days of flying with one IDG inoperative breaks the assumed link between "failed" and "unavailable": the fault is open, the removal is scheduled, and the aeroplane is still earning. That availability is bought with a rule rather than with hardware or stock, and the rule is affordable only because the redundancy is real. Treat it as free capacity and the gain has been withdrawn from the safety margin without anyone recording the withdrawal.
What a different technique would have given
The obvious alternative is the parallel product rule from the composition chapter: two IDGs, independent repair, so multiply their unavailabilities. Each generator's unavailability with the full outstation event is 250 × 10⁻⁶ × 27.5 = 6.875 × 10⁻³, and the pair gives
q² = (6.875 × 10⁻³)² = 4.7 × 10⁻⁵
which is 0.14 hours per aircraft-year against the 11.4 the operator actually books, optimistic by a factor of eighty. The error is not arithmetic. It is that q² answers "how often does the aeroplane have no AC power", and nobody asked that; the question was whether it may be dispatched, and dispatch is decided by a rule that counts a single inoperative generator, not by the coincidence of two.
The closed-form Ao is the more interesting rejection, because it is right. Applying the 26-hour penalty to 22% of removals reproduces 3.8 × 10⁻³ exactly, and for the annual fleet report that is all that is needed. It was rejected anyway, because it cannot represent a spare shared between two aircraft, cannot represent the correlation between removals and the stations that fly the most hours, and cannot produce the breach rate against the three-day allowance. A technique can give the correct number and still be the wrong tool: the mean was never the decision.