

An electro-hydraulic brake actuator, two brake ECUs, four wheel-speed sensors, an independent backup hydraulic path and the regenerative torque interface, fitted to 200,000 vehicles that each run about 500 hours a year. The repair takes 1.2 hours. The car is off the road for a day and a half, and the owner's memory of the event is the day and a half.
That gap is the whole page. Availability in a consumer fleet is not a percentage and cannot usefully be made into one, because the denominator that matters is not the calendar but the handful of mornings during the outage when somebody wanted to drive. Getting that denominator wrong produces a number that is arithmetically flawless and commercially meaningless, and the industry's decision to report vehicle-off-road days instead is a considered rejection of the availability formula rather than an ignorance of it.
The technique, and why this one
Event-based downtime accounting in vehicle-off-road days, built as a rate-times-duration renewal calculation on a user-demand denominator, with a first-visit-fix multiplier applied to convert downtime per visit into downtime per fault. The choice is forced by three features. The duty cycle is 6% of the calendar, so any clock-based ratio is dominated by hours in which the vehicle's availability was never tested. The events are rare and independent, so a renewal calculation (rate times duration, summed across the fleet) is exact and needs nothing more elaborate. And the diagnostic process generates repeat visits, which a naive per-visit metric silently discards.
| Item | Availability model | Parameters |
|---|---|---|
| Brake ECU (2 fitted) | exponential | λ = 60 per 10⁶ h each |
| Electro-hydraulic actuator | Weibull in service (β = 1.4, η = 9,500 h), constant rate at design | λ = 180 per 10⁶ h |
| Wheel-speed sensor set (4) | exponential | λ = 90 per 10⁶ h |
| Backup hydraulic path | dormant, periodically tested | λ = 20 per 10⁶ h; exercised at the annual service, T = 500 h |
| Event duration | empirical, decomposed | 1.4 VOR days (33.6 h), of which 0.9 days (21.6 h) is parts |
| First-visit fix | binomial multiplier | isolation to one replaceable unit 82% of the time |
| Denominator | user demand | 500 operating hours per vehicle-year |
The percentage, computed and discarded
Do the conventional calculation first, precisely so that it can be rejected. The tabulated items sum to 410 per 10⁶ hours, but the dormant backup hydraulic path's 20 is not among them for this purpose: its failure never puts a car off the road, which is the whole subject of the last section of this page. The rate that generates vehicle-off-road incidents is therefore 390 per 10⁶ hours, which at 500 operating hours a year is
incidents = 390 × 10⁻⁶ × 500 = 0.195 per vehicle-year
Each costs 1.4 days off the road, so
downtime = 0.195 × 33.6 = 6.6 hours per vehicle-year
Aclock = 1 − 6.6 / 8,760 = 0.99925
Three nines and change, which sounds excellent and settles nothing. The vehicle is parked for 94% of the year, so almost the entire numerator of that fraction is time nobody was going to use it. Move to the operating clock and the same 6.6 hours against 500 hours gives 0.9869, an availability an order of magnitude worse, and that number is not right either, because the outage does not consume operating hours; it consumes days. The measure has to match the demand the user actually makes, and the user makes a demand shaped like a morning, not like an hour. That is why the fleet reports 1.4 vehicle-off-road days and refuses to divide it by anything.
Where the 33.6 hours go
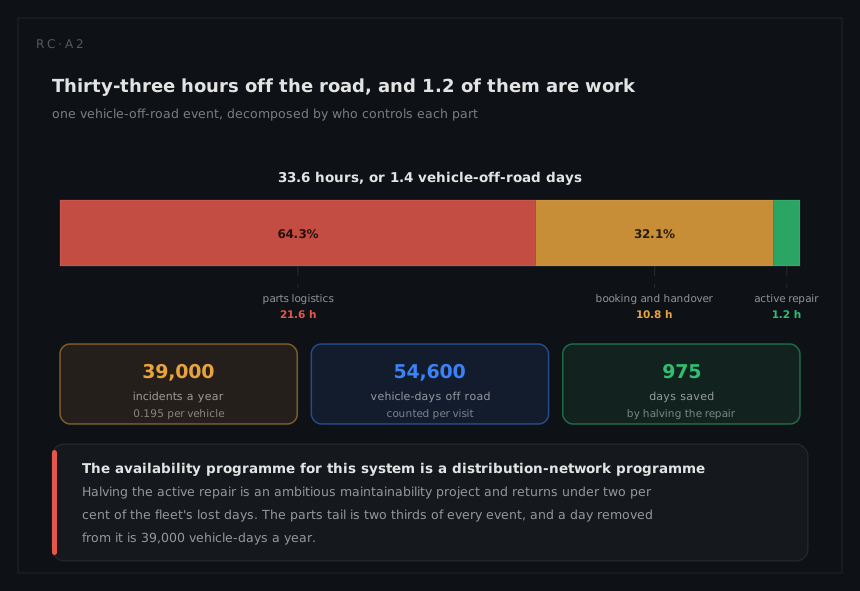
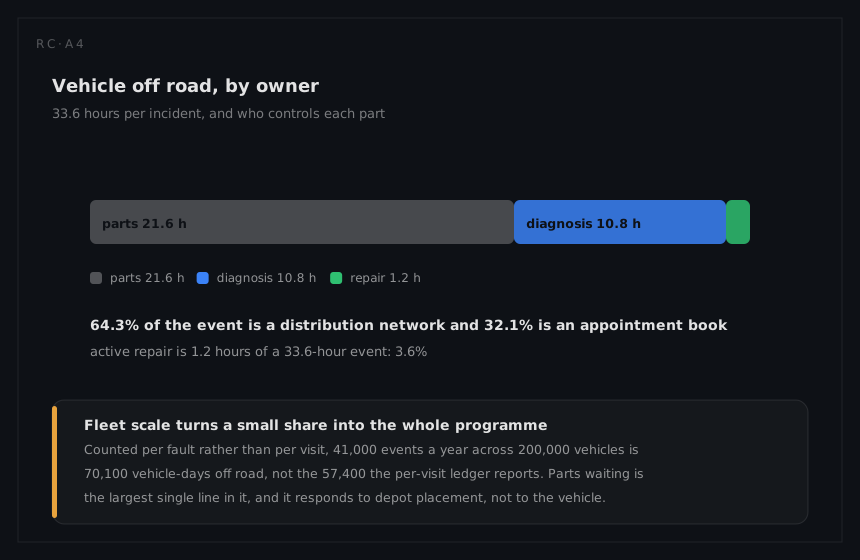
The event decomposes cleanly, and the decomposition is the finding:
| Element | Hours | Share |
|---|---|---|
| Parts logistics | 21.6 | 64.3% |
| Diagnosis, booking, workshop scheduling, handover | 10.8 | 32.1% |
| Active repair | 1.2 | 3.6% |
Multiplied across the fleet, 200,000 vehicles at 0.195 incidents each generate
39,000 incidents a year × 1.4 days = 54,600 vehicle-days off road
of which
39,000 × 0.9 = 35,100 vehicle-days are spent waiting for a component to arrive
No plausible reduction in repair time competes with that. Halving the 1.2-hour active repair, an ambitious maintainability programme in its own right, saves 39,000 × 0.6 hours, about 975 vehicle-days a year out of 54,600: under two per cent. The availability improvement plan for this system is a distribution-network plan, and it is the same finding the aircraft reached at the other end of this column, arriving from an industry three orders of magnitude larger in unit count and with nothing else in common.
The multiplier that hides in the visit count
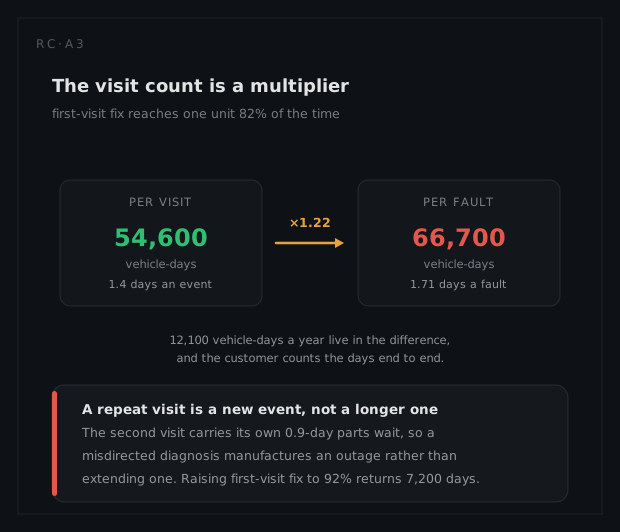
Fault isolation reaches a single replaceable unit 82% of the time. The remaining 18% of visits fit a component that was not the cause, and the customer returns. Expected visits per fault is the mean of that geometric process, 1/p:
visits per fault = 1 / 0.82 = 1.22
downtime per fault = 1.22 × 1.4 = 1.71 VOR days
fleet visits = 39,000 / 0.82 = 47,600 a year
fleet downtime on a per-fault basis = 39,000 × 1.71 = 66,700 vehicle-days
So the honest fleet figure is 66,700 vehicle-days, not 54,600: counting downtime per visit rather than per fault flatters the metric by 12,100 vehicle-days a year, and the customer counts the days end to end. The second visit is not a rounding error either, because it carries its own 0.9-day parts wait; a misdirected diagnosis does not lengthen an event, it manufactures a new one.
The no-fault-found rate compounds it. Twenty-one per cent of returned brake ECUs have nothing wrong with them, which means a fifth of the ECU replacements in that 47,600-visit stream consumed a part, a bay and a customer's day without addressing a fault. The testability page owns both the 82% and the 21% and shows what closes them; from the availability side they are simply a 22% inflation of the fleet's downtime and a 22% inflation of its spares consumption at the same time.
The path nobody measures
The backup hydraulic path is dormant. It is exercised only at the annual service, so its unavailability is governed by the test interval, not by any repair:
Qbackup = λT / 2 = 20 × 10⁻⁶ × 500 / 2 = 5.0 × 10⁻³
Half a per cent of the time the vehicle's independent backup braking path is not there, and nothing in the vehicle or in the dealer's records will say so. Against a fleet availability that the owner experiences as essentially perfect, this is the least available element of the system by nearly a factor of seven (5.0 × 10⁻³ against the 7.5 × 10⁻⁴ the clock-based figure implies), and it is the one the ASIL D decomposition leans on. This is why it was kept out of the VOR rate at the top of the page: it never puts a car off the road, so it belongs in a second ledger kept in a different currency, and the discipline of keeping both is the point.
What the analysis tells the engineer to do
Forward-stock the actuator and the ECU at regional level so the 0.9-day parts wait becomes a next-morning delivery. At 39,000 incidents a year, each day removed from the parts tail is 39,000 vehicle-days, which dwarfs anything the workshop can contribute; this is a level-of-repair and stocking decision, made once, with fleet-wide effect.
Then attack the 18%. Raising first-visit fix from 82% to 92% takes visits per fault from 1.22 to 1.09 and fleet downtime per fault from 66,700 to 59,500 vehicle-days, a 7,200-day saving from a diagnostic improvement with no logistics content at all. And treat the 10.8 hours of booking, scheduling and handover as a real line rather than an overhead: it is a third of the event, larger than everything the design team controls, and it is the cheapest slice in the ledger to measure and the most embarrassing to leave unmeasured.
Finally, note what the Weibull fit does to the forecast. The actuator's warranty returns fit β = 1.4, η = 9,500 hours, so its arrival rate is not stationary: the fleet's incident rate, and therefore its VOR consumption, rises as the population ages. A budget built on 0.195 incidents per vehicle-year is a budget for a young fleet.
What a different technique would have given
The alternative is the one the formula invites: steady-state availability on the calendar clock, A = MTBF/(MTBF + MDT), giving 0.99925. It is not an approximation of the right answer; it is an answer to a question nobody asked. It would rank a fault that strands 39,000 customers for a day and a half as a 0.08% problem, it would improve if owners drove less, and it offers no way to see that two thirds of the loss is a parts network. Worse, it invites the nines vocabulary from the storage array at the other end of this column, where five nines is a meaningful engineering target because the machine runs continuously and the outage is measured in minutes. Borrowing that vocabulary here produces a number with three nines in it and no information.
A second candidate, an availability model that credits the dual ECUs and the backup hydraulic path as parallel redundancy, would have been worse still: it would multiply unavailabilities, report that the brake system is effectively never unavailable, and miss the fact that redundancy in this vehicle exists to preserve safe braking, not to keep the car out of the workshop. A car with one failed ECU and a working backup is safe, drivable in the engineering sense, and still going to the dealer.