

Two brake ECUs, an electro-hydraulic actuator, four wheel-speed sensors and an independent backup hydraulic path, replicated across two hundred thousand vehicles whose owners are not maintainers and whose dealers are not laboratories. There is no crew to report a symptom and no engineer at the roadside. Whatever the vehicle does not diagnose about itself is not diagnosed, and whatever the vehicle says about itself is what a technician will act on.
That second half is where this system's testability problem actually lives. Detection is comparatively easy on a modern brake system: the electronics are redundant, they watch each other, and 94% of the failure rate announces itself. The difficulty is that announcing is not the same as naming. When a diagnostic trouble code implicates two units instead of one, somebody replaces a healthy part, and at fleet scale that arithmetic turns into a warranty line item large enough to see from the accounts.
The technique, and why this one
Ambiguity-group expected-swap arithmetic, computed from the dependency model's response signatures and then reconciled against the field's measured no-fault-found rate. The choice is driven by what the system has that the others in this chapter mostly do not: a fleet large enough to close the loop. A design-stage isolation figure is a forecast; a returns stream of thousands of units a year is a measurement of the same quantity, and putting the two side by side is the only way to learn whether an isolation shortfall is structural (the design made two units indistinguishable) or behavioural (the diagnosis was fine and the part was swapped anyway).
| Item | λ per 10⁶ h | Model used | Test means credited |
|---|---|---|---|
| Brake ECU (each, 2 fitted) | 60 | constant λ; no wear-out signature in the returns | continuous self-test plus cross-check between the two ECUs |
| Electro-hydraulic actuator | 180 | Weibull, β = 1.4, η = 9,500 h, fitted by maximum likelihood from warranty returns | pressure and position feedback against commanded state |
| Wheel-speed sensor set (4) | 90 | constant λ | four-way plausibility comparison across the wheels |
| Backup hydraulic path | 20 | constant λ, dormant and passive | annual service exercise only |
The actuator carries a Weibull because the warranty database says so. Twenty-four months of returns from 200,000 vehicles, fitted with the 96% of the fleet that has not failed carried as suspensions, give β = 1.4: early wear, not random failure. The reliability page works the consequence for the life requirement. Its consequence for testability is separate and is developed below.
Rolling up the coverage
FDR = Σλ(detected) / Σλ(all)
| Item | λ per 10⁶ h | Detected | Undetected λ |
|---|---|---|---|
| Brake ECUs (2) | 120 | 98.0% | 2.4 |
| Electro-hydraulic actuator | 180 | 96.0% | 7.2 |
| Wheel-speed sensor set | 90 | 96.0% | 3.6 |
| Backup hydraulic path | 20 | 43.0% | 11.4 |
| Total | 410 | 24.6 |
FDR = (410 − 24.6) / 410 = 385.4 / 410 = 0.940
The power-up self test is what makes 94% reachable at all, and the reason is duty cycle rather than sophistication. A vehicle performs several hundred start-up cycles a year, so the readiness check runs constantly by accident of use and every drive begins with a fresh verdict on the paths the test reaches. Set that against the level crossing, where nothing initiates a test unless a person schedules one, and the coverage gap between 94% and 78% stops being a statement about electronics and becomes a statement about how often the machine is switched on.
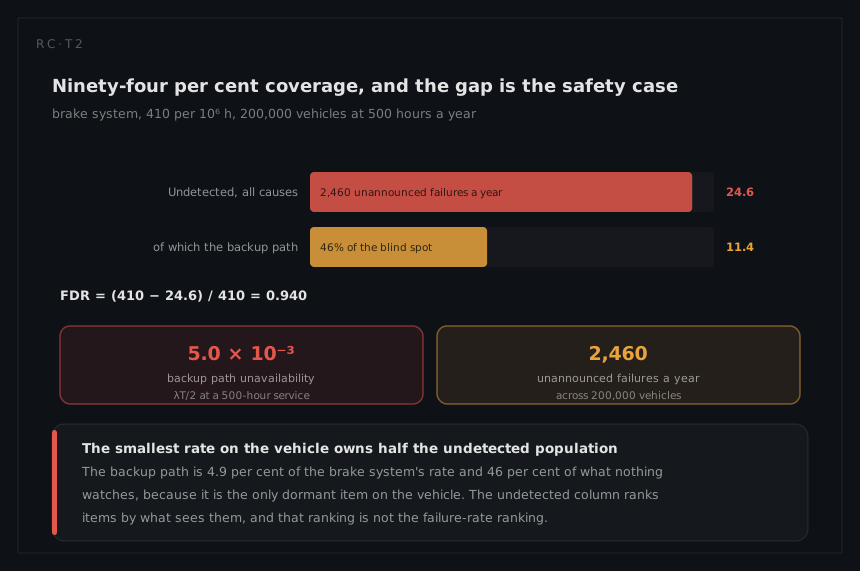
The undetected column carries the real news. The backup hydraulic path is 4.9% of the failure rate and 46% of the entire undetected budget: 11.4 of the 24.6. It is by far the worst-covered item in the system and by far the most important one to cover, and no percentage-only report would ever say so.
The service interval is a safety parameter
The backup path exists because the safety page decomposes an ASIL D requirement into two ASIL B(D) legs, one electronic and one hydraulic, and the whole force of that decomposition rests on the second leg being present when the first fails. A dormant leg exercised only at the annual service, at 500 operating hours a year, carries
Ulatent = λT/2 = 20 × 10⁻⁶ × 500 / 2 = 5.0 × 10⁻³
so roughly one drive in two hundred begins with an independent leg that may already be gone, and neither the driver nor the vehicle can know. Across the fleet, 200,000 vehicles at 500 hours each is 10⁸ vehicle-hours a year, and the undetected population as a whole runs at
unannounced failures per year = 24.6 × 10⁻⁶ × 10⁸ = 2,460
against 41,000 failures in total. The service interval, chosen for oil and filters and customer convenience, is therefore doing structural work in a safety argument. Halving it halves the latent term exactly, and the only alternative that does not touch the schedule is to find a way to exercise the hydraulic leg without a workshop: a brief pressurisation of the backup circuit during the power-up sequence, which is the same move the process industry makes with a partial stroke.
What the returns stream says about isolation
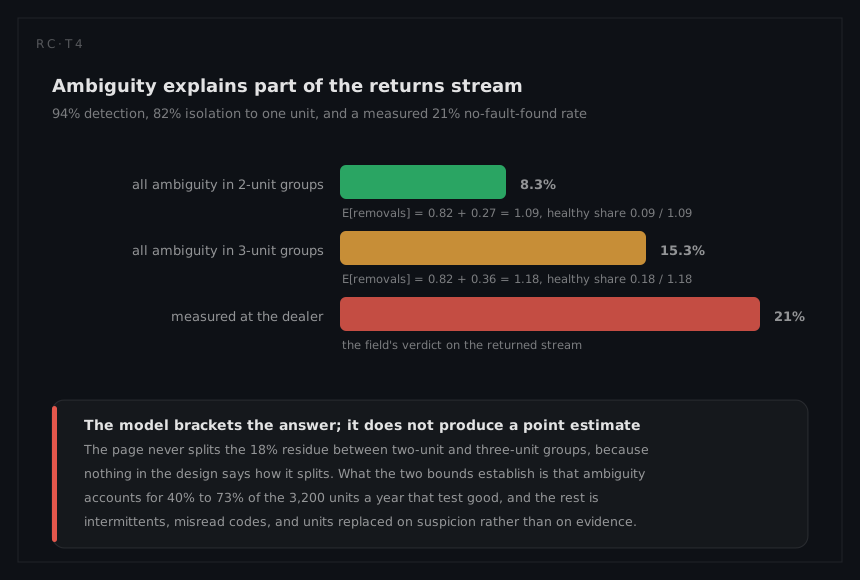
Isolation to a single replaceable unit succeeds 82% of the time. The residue arrives as a group of suspects, and with equal priors a sequential swap-and-retest through a group of n resolves the fault after (n+1)/2 attempts on average:
E[removals per detected fault] = 0.82 × 1 + 0.18 × (n+1)/2
For two-unit groups, 0.82 + 0.27 = 1.09. For three-unit groups, 0.82 + 0.36 = 1.18. Expressed as the share of the returned stream that is healthy, that is 0.09/1.09 = 8.3% at best and 0.18/1.18 = 15.3% at worst.
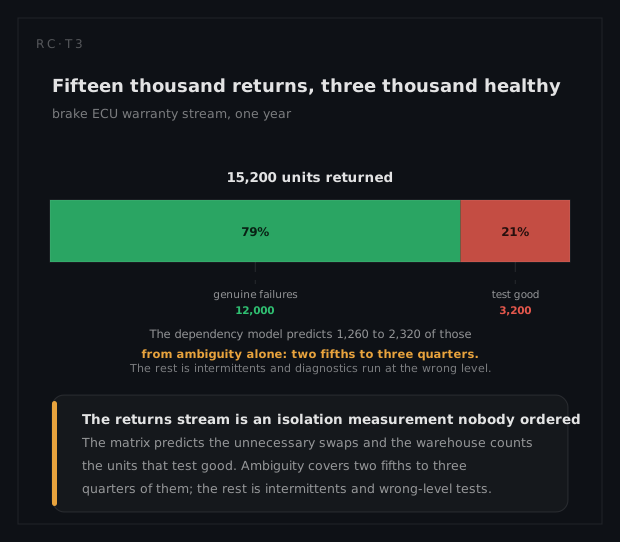
Now the field's answer. Two ECUs at 60 per 10⁶ hours give 120 per 10⁶ hours per vehicle, and across 10⁸ vehicle-hours a year:
genuine ECU failures per year = 120 × 10⁻⁶ × 10⁸ = 12,000
With a measured no-fault-found rate of 21%, the genuine failures are 79% of what arrives at the bench:
returned units = 12,000 / 0.79 = 15,200, of which 3,200 test good
Reconciling the two: ambiguity alone accounts for between 1,260 and 2,320 of those 3,200. The dependency model explains roughly two fifths to three quarters of the no-fault-found stream, and the remainder is something else, most plausibly intermittent faults that latch a code and clear, plus units returned on a customer complaint without a diagnosis at all. Separating the two halves matters because they have different owners: the structural share belongs to the design, and the rest belongs to thresholds and to workshop process.
What the analysis tells you to do
The priority order is set by the undetected column, not the failure-rate list. First, get the backup hydraulic path exercised more often than annually, because 11.4 per 10⁶ hours of undetected rate on the leg that carries half a decomposed ASIL D requirement is the largest single testability defect in the vehicle. Second, attack the ambiguity groups the model identifies rather than raising detection: the design already announces 94%, and a further point of detection is worth far less than splitting one signature that currently implicates two units. At 1.2 hours of active repair, 3,200 wrong removals a year is 3,840 hours of dealer labour spent on healthy parts, before the freight, the stock and the false entries in the failure records. Third, use the actuator's shape. With β = 1.4 the hazard rises,
h(500) = (1.4/9,500) × (500/9,500)^0.4 = 1.474 × 10⁻⁴ × 0.308 = 4.54 × 10⁻⁵ per hour
h(2,000) = (1.4/9,500) × (2,000/9,500)^0.4 = 1.474 × 10⁻⁴ × 0.536 = 7.90 × 10⁻⁵ per hour
45 per 10⁶ hours at one year rising to 79 at four, which means the actuator degrades before it fails and a monitor that trends pressure-rise time has something to watch. A threshold monitor throws that warning away and reports only the event.
What a different technique would have given
The alternative most often adopted is to treat the 21% no-fault-found rate as a workshop problem: better technician training, tighter warranty authorisation, a requirement that a code be confirmed before a part is ordered. It is a reasonable-sounding response and it is aimed at the wrong half of the number. Training can reach the intermittents and the undiagnosed returns, which the reconciliation above puts at roughly 880 to 1,940 units a year. It cannot reach the 1,260 to 2,320 that arise because the design gave two units the same symptom signature; no amount of skill isolates what the partitioning made indistinguishable.
Running the ambiguity arithmetic first tells you the ceiling before the money is spent: a perfect workshop still returns at least 8.3% healthy units, so a programme targeting "no-fault-found below 5%" through process alone has set an impossible goal and will conclude, wrongly, that its technicians are the problem. Isolation is a design output measured in the supply chain, and the two ends have to be reconciled before either is acted on. Tracking the split through FRACAS is what keeps them honest.