

Two brake ECUs, an electro-hydraulic actuator, four wheel-speed sensors, an independent backup hydraulic path and a regenerative torque interface, fitted to 200,000 vehicles that each drive 500 hours a year. Nothing in that description tells you how much rigour the design deserves. A brake system on a milk float and a brake system on a family car have the same block diagram and are not the same engineering problem, and the difference is not in the hardware.
The automotive regime settles it before any hardware exists, by describing the hazard as a situation rather than as a failure. The situation here is unintended loss of service braking above 50 km/h. It is assessed on three axes: how badly it ends, how often a driver is in it, and whether an average driver can retrieve it. Those three judgements select an integrity class, the class decides how much process rigour and how much architectural evidence the design must carry, and only then does anyone reach for a failure rate.
The technique, and why this one
Severity, exposure and controllability determination to an integrity class, followed by a decomposition whose entire value is an independence claim, checked with a dormancy calculation on the second path. The reason for the three-axis method rather than a straight probability target is that a failure rate is silent about the two things that matter most in a road vehicle: whether the driver is in the hazardous situation when the failure arrives, and whether the driver can do anything about it. The same actuator failing at 5 km/h in a car park and at 130 km/h on a motorway has the same λ and a completely different consequence.
| Input | Assessment | Basis |
|---|---|---|
| Hazard | Unintended loss of service braking above 50 km/h | a situation, not a component failure |
| Severity | S3, life threatening or fatal | the outcome if the situation is not retrieved |
| Exposure | E4, high, present on essentially every drive | all 500 operating hours a year qualify |
| Controllability | C3, difficult for an average driver to control | the retrieval judgement |
| Resulting class | ASIL D | the lookup, not a calculation |
| Decomposition | ASIL B(D) primary electronic path plus ASIL B(D) independent backup hydraulic path | permitted in exchange for proven independence |
| Primary path λ | 390 per 10⁶ h (ECU 60 × 2, actuator 180, sensors 90) | exponential for the electronics |
| Actuator ageing | Weibull, β = 1.4, η = 9,500 h, B10 = 1,904 h | fitted from warranty returns |
| Backup path | 20 per 10⁶ h, dormant, exercised annually at T = 500 h | λT/2 = 5.0 × 10⁻³ |
Three points about that table are worth pausing on. Exposure is a quantity, not an adjective: at 500 operating hours a year the hazardous situation is present for essentially all of them, which is what E4 means and what makes it non-negotiable here. Controllability is an engineering input that can legitimately be argued down with evidence, and arguing it down changes the class, which is why it attracts more debate than any other line in a hazard analysis. And the resulting ASIL D is a lookup from the three axes, not the output of an arithmetic model, which is the first thing an engineer arriving from a probability-based regime has to accept.
The decomposition, and what it actually promises
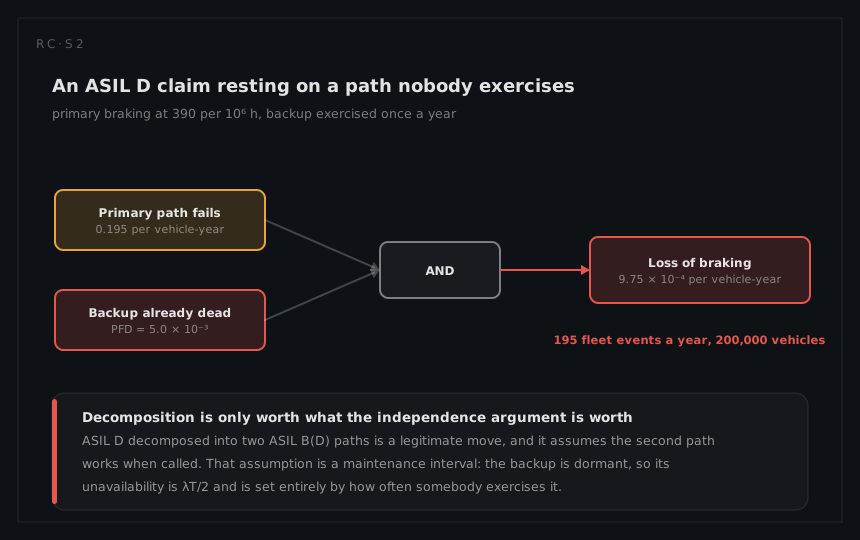
An ASIL D requirement met by two paths at ASIL B(D) each is a standard move and a sound one. The notation is not a probability split. It is a permission: you may develop each path to a lower rigour provided you can show that no single cause defeats both.
Here the promise is credible, because the second path is hydraulic. Different physics, a different energy path, different failure mechanisms, a different supplier, no shared software and no shared clock. Two software channels running on one ECU off one supply would carry the same B(D) notation and none of the substance, and the independence arguments that separate the two cases are set out in the systems chapter.
What the decomposition is worth quantitatively falls straight out of the dormancy calculation. The primary path is a series chain:
λprimary = 60 + 60 + 180 + 90 = 390 per 10⁶ h
Fprimary = 390 × 10⁻⁶ × 500 = 0.195 per vehicle-year
The backup path is not operating, so its contribution is not a rate but the probability it is already unusable when the primary calls on it. Exercised only at the annual service:
PFDbackup = λT/2 = 20 × 10⁻⁶ × 500 / 2 = 5.0 × 10⁻³
and the hazard needs both:
Fhazard = 0.195 × 5.0 × 10⁻³ = 9.75 × 10⁻⁴ per vehicle-year
Across the fleet:
9.75 × 10⁻⁴ × 200,000 = 195 events a year
Compare that with the fleet's ordinary failure count. The system runs at 410 per 10⁶ hours in series, which is 0.205 failures per vehicle-year and roughly 41,000 fleet events a year, of which 195 are the hazard. The second leg is worth exactly 1/PFD, that is a factor of 200, and PFD is set by a service interval rather than by anything in the hardware.
The number that is a maintenance schedule in disguise
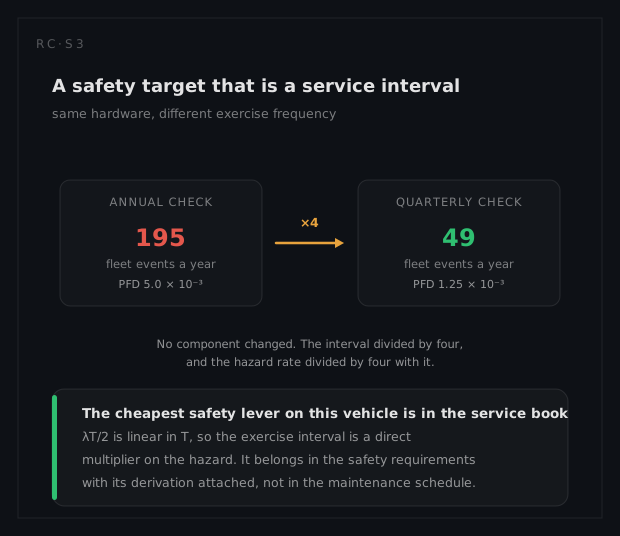
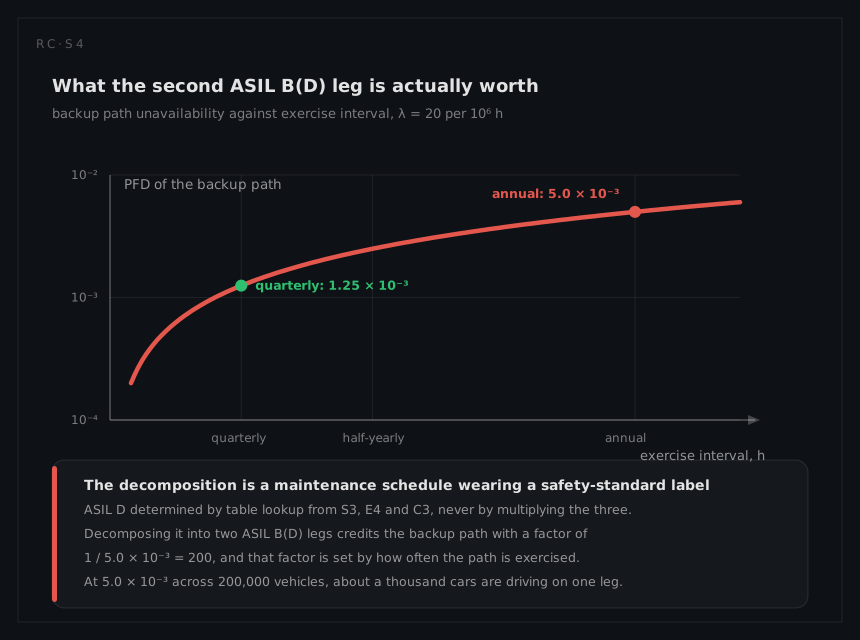
Because PFD is linear in T, the cheapest safety improvement available in this system is a line in the service book. Exercising the backup quarterly instead of annually takes T from 500 to 125 operating hours:
PFDbackup = 20 × 10⁻⁶ × 125 / 2 = 1.25 × 10⁻³
Fhazard = 0.195 × 1.25 × 10⁻³ = 2.44 × 10⁻⁴ per vehicle-year, or 49 fleet events a year
One hundred and forty-six fewer events a year, from a change that costs no hardware and no development. That is a decomposition being made worth what it claims, and the mechanism to deliver it already exists: on-board diagnostics with a power-up self test already cover 94 per cent of failure rate, and whether that self test reaches the backup path is the question the testability column settles.
There is a corollary that is easy to miss. At the annual interval, 5.0 × 10⁻³ of 200,000 vehicles is about 1,000 cars on the road at any moment with one of their two ASIL B(D) legs already gone. Those cars are not at ASIL D. They are at ASIL B, and nothing on the dashboard says so.
What ageing does to the argument
The ASIL D case was built on a constant 180 per 10⁶ hours for the actuator. The warranty returns say β = 1.4, so the hazard rises:
h(t) = (β/η)(t/η)^(β−1) = (1.4 / 9,500) × (t / 9,500)^0.4
At two years of driving (1,000 h) that is 1.474 × 10⁻⁴ × 0.4063 = 6.0 × 10⁻⁵ per hour, 60 per 10⁶ hours. At ten years (5,000 h) it is 1.474 × 10⁻⁴ × 0.7736 = 1.14 × 10⁻⁴ per hour, 114 per 10⁶ hours. Both sit below the design constant, so the absolute numbers improve, and the shape is still the finding. Substituting into the primary chain:
λprimary(2 years) = 120 + 60 + 90 = 270 per 10⁶ h → 135 fleet hazard events a year
λprimary(10 years) = 120 + 114 + 90 = 324 per 10⁶ h → 162 fleet hazard events a year
A monotone twenty per cent drift that no constant-rate model predicts and that a three-year warranty window will never observe. Meanwhile the requirement was written in the currency the shape controls: B10 ≥ 3,000 hours, and the fitted B10 is 1,904 hours, under four years of driving. One vehicle in ten loses its actuator inside four years. That is a safety finding, not a warranty finding, because the actuator sits in one of the two legs the ASIL D case was decomposed onto, and the reasoning behind the fit is on the reliability page.
What the analysis tells the engineer to do
Exercise the backup path more often than annually, and make the exercise a diagnostic the vehicle performs rather than a task a dealer records. It is the largest available factor and the cheapest.
Prove the independence claim physically and revisit it whenever a supplier, a wiring route or a power architecture changes. A decomposition survives a design change only if somebody checks that it did.
Treat the B10 shortfall as an integrity issue. Meeting an average and missing a percentile is exactly the failure mode of a design signed off on a constant rate.
Fix the 21 per cent no-fault-found rate on returned brake ECUs. The field data is the evidence the whole argument now rests on, and one return in five is telling the database something untrue.
What a different technique would have given
Suppose the same system had been assessed with a purely quantitative random-hardware target, the approach that serves the compressor and the diesel elsewhere in this chapter. The arithmetic above already produces it: 1.95 × 10⁻⁶ per operating hour with the backup credited, against 3.9 × 10⁻⁴ per hour without. A probability-based case would declare the first adequate and close.
Three things it could not have done. It could not distinguish the hazard at 5 km/h from the hazard at 130 km/h, because the rate is identical and only the severity differs, so it would spend the same effort on both. It could not decide how much development rigour the ECU software needs, because software has no random failure rate and the entire systematic argument sits outside the probability. And it would be indifferent to whether the two paths shared an ECU, a supply rail or a supplier, since a probability model that has been told the paths are independent will happily multiply. The three-axis method exists to make severity, exposure and controllability decide how much rigour is bought, which is a claim about process, not about probability, and the classification ladders that encode it are compared in the foundations chapter.