

Two active-active controller boards, dual hot-swappable power supplies, drive shelves, and a lithium backup unit that holds the write cache alive when the mains goes. The array is engineered to five nines, which is 5.3 minutes of downtime a year, and every analysis the programme runs is about keeping a service available. The safety analysis is looking at a different object entirely.
Nothing in this rack can hurt anybody by stopping. Losing the array breaches a service level agreement. What can hurt somebody is the one component that stores energy: a lithium unit whose failure mode is thermal runaway, mounted in a chassis, in a rack, in a room full of other racks, in a building. This page is about a hazard that is not a loss of function, and about what happens to the usual engineering instincts when the thing you are analysing is a source rather than a path.
The technique, and why this one
An energy-based hazard identification, followed by a barrier argument against release, with the item failure rate converted to a mode rate before any probability is quoted. The functional methods that serve the rest of the array, RBD success paths and a Markov model of the repairable controller pair, ask what happens when a block stops working. The hazard here is produced by a component doing something, not by a component stopping, and no success-path method has a place to put that.
| Object | Model | Value | What the analysis wants from it |
|---|---|---|---|
| Controller board, 2 fitted | FIT parts count, exponential | 3,000 FIT = 3.0 per 10⁶ h each | function only |
| Power supply, 2 fitted | exponential, hot-swappable | 1,500 FIT each | function only |
| Drive | annualised failure rate | 0.4% AFR | function only |
| Single controller unavailability, 4 h response | Markov | q = 1.2 × 10⁻⁵ | function only |
| Controller pair, independent repair | q² | 1.4 × 10⁻¹⁰ | function only |
| Lithium backup unit | energy source | 900 FIT = 0.9 per 10⁶ h, all modes | the hazard, after a mode split |
| Barriers | layer credit | cell protection, containment, state-of-health monitor | how release is prevented and limited |
The functional answer, and why it ends the wrong conversation
Work the availability side first, because it is short. A single controller with a four-hour on-site response sits at q = 1.2 × 10⁻⁵. Two of them with independent repair give
qpair = q² = (1.2 × 10⁻⁵)² = 1.44 × 10⁻¹⁰
and the two-state repairable form used in the reliability treatment gives 2q² = 2.9 × 10⁻¹⁰. Both are small enough to stop being interesting: the five-nines target of 0.99999 corresponds to (1 − 0.99999) × 525,600 = 5.3 minutes a year, and the controller pair contributes microseconds of it. The real constraints on availability are the shared backplane, the shared firmware build and the disruptive update, none of which the pair arithmetic sees.
That is a complete and correct analysis of the wrong object. It says nothing at all about the lithium unit, because the lithium unit's contribution to loss of function is negligible and its contribution to loss of a building is not in the model.
The number the table does not contain
Start from what is given. The lithium backup unit runs at 900 FIT, which is 0.9 per 10⁶ hours, and over a five-year service life of 43,800 hours the expected failures per unit are
0.9 × 10⁻⁶ × 43,800 = 0.0394
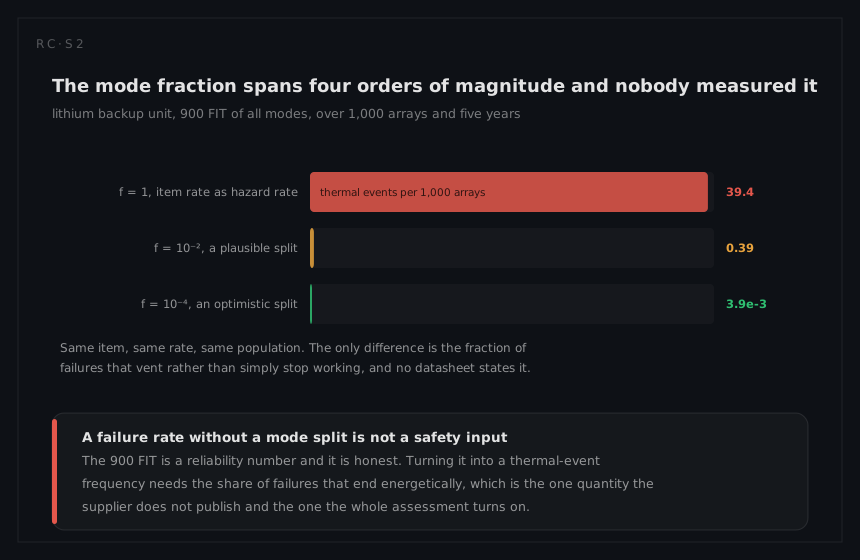
about one unit in twenty-five, or 39.4 unit failures per thousand arrays over five years. Now the essential move. That 900 FIT covers every way the unit can fail, and the overwhelming majority of those ways are benign: it stops holding charge, it reports a degraded state, it is swapped at the next service call. The hazardous mode is some fraction f of the 900, and the table does not give f.
Watch what the answer does when f moves:
f = 1 (item rate treated as hazard rate): 0.9 per 10⁶ h → 39.4 thermal events per 1,000 arrays in 5 years
f = 10⁻²: 9 FIT → 0.39 events per 1,000 arrays in 5 years
f = 10⁻⁴: 0.09 FIT → 3.9 × 10⁻³ events per 1,000 arrays in 5 years
Four orders of magnitude of answer, driven entirely by a number that has to be established mode by mode. The mode split is the analysis; the item rate is merely an input to it, and no honest argument may quietly treat one as the other. This is the step an FMEA exists to produce and the step most often skipped, precisely because the component rate is available and the mode split has to be worked for.
Barriers, and the arithmetic of layers
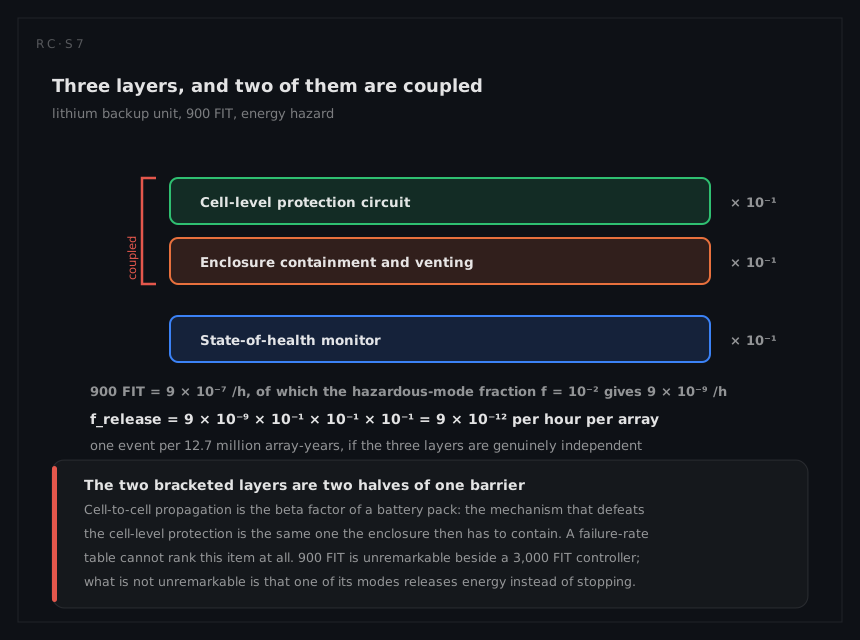
With an initiating frequency established, the residual risk is the initiating frequency reduced by the independent layers between the event and the harm. The design response named for this unit is three layers, and they make three different assumptions about what has already gone wrong: cell-level protection tries to prevent the runaway, enclosure containment accepts that prevention can fail and limits what the failure reaches, and the state-of-health monitor detects the approach in time for a human to act.
Credited at the conventional order of magnitude per independent layer, and taking f = 10⁻² as a working figure:
frelease = 9 × 10⁻⁹ × 10⁻¹ × 10⁻¹ × 10⁻¹ = 9 × 10⁻¹² per hour per array
over 5,000 array-years: 9 × 10⁻¹² × 43,800 × 1,000 = 3.9 × 10⁻⁴ events
one event per 12.7 million array-years. The credit is only as good as the independence, and in a battery pack the independence has a specific enemy: cell-to-cell propagation. A single cell going into runaway that ignites its neighbours converts one cell's event into the whole unit's, which means the cell-level protection and the containment are not independent layers at all but two halves of one. Propagation is the beta factor of a battery pack, and it is attacked with spacing, thermal barriers and vent routing rather than with better cells.
Where the two properties point in opposite directions
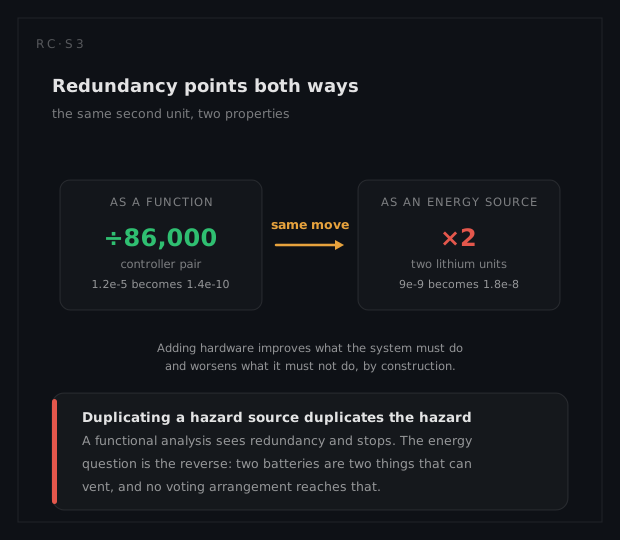
Here is the finding that makes this row worth its place. Redundancy, the move that improves every functional number in the table, makes the energy hazard strictly worse.
function: one controller q = 1.2 × 10⁻⁵ → pair q = 1.4 × 10⁻¹⁰, better by a factor of 8.6 × 10⁴
energy: one lithium unit 9 × 10⁻⁹ per hour → two units 1.8 × 10⁻⁸ per hour, worse by a factor of 2
A second backup unit doubles the stored energy in the chassis and doubles the frequency of the initiating event, while improving write-cache protection and every availability figure the programme reports. This is the only place in the chapter where an engineer's reflex, add another one, is quantifiably the wrong move, and it is worth noticing that the availability model would recommend it and never mention the cost.
Detection has a similar asymmetry. In-service telemetry and drive self-monitoring reach 97 per cent of failure rate, so the uncovered fraction of the lithium unit is
0.03 × 0.9 = 0.027 per 10⁶ h = 27 FIT
over 43,800 h: 27 × 10⁻⁹ × 43,800 = 1.18 × 10⁻³ per unit, about one unit in 850
which announces nothing at all. And the state-of-health monitor should not be measured by its coverage percentage in the first place. Its value is warning time, and a monitor that flags an approaching runaway ten minutes ahead and one that flags it ten days ahead score identically on coverage and are worth completely different amounts. The testability page works the coverage arithmetic that this hazard needs restated.
What the analysis tells the engineer to do
Get the mode split before quoting any hazard probability. The four-order-of-magnitude spread above is the finding, and closing it is worth more than any other analysis activity on this component.
Do not add a second lithium unit for availability. The availability it buys is already below the measurement floor and the hazard it adds is real and doubles.
Specify containment against propagation explicitly, and test it as a pack rather than as a cell, because the pack is where the independence claim is either true or false.
Measure the state-of-health monitor in warning time and design the response around the time it actually gives.
Stop returning no-fault-found lithium units to stock. At 24 per cent, the no-fault-found rate on returns is the dominant warranty cost and it is also a safety problem: a unit whose fault was not found and whose state of health is therefore asserted rather than measured is going back into a rack on the strength of a diagnostic that failed once already.
What a different technique would have given
Take the lithium unit through the same treatment as everything else in the array. An availability model calls it a block whose failure loses write-cache protection, applies the four-hour response, and reports
unavailability = 0.9 × 10⁻⁶ × 4 = 3.6 × 10⁻⁶
notes that the array survives it comfortably, and closes the item as non-critical. Every step of that is correct and the conclusion is upside down, because the model asks what happens when the battery stops working and the hazard is what happens when it works too hard. A function-loss analysis cannot see an energy-release hazard, and the reason is structural rather than a matter of effort: success-path methods enumerate the ways a system fails to deliver, and this failure delivers something extra.
An FMEA on loss of function fails the same way for the same reason. It would list "backup unit fails to hold charge", assign the effect "write cache unprotected during mains loss", note the mitigation, and never write a line about heat. The five-nines target that drives every other decision on this array is silent on the only object in the rack that can start a fire, and a programme that never runs an energy-based identification will not discover that, because nothing in its method asks the question.