

A level crossing fails about seventeen times a year and almost none of those failures can hurt anybody. That sentence is the whole design. The crossing has a 2oo2 vital processor, two barrier drive units, axle-counter train detection, four road-signal lamp units and a road-loop vehicle detector, and it will lose one of them regularly. What the safety argument has to establish is not that the crossing is reliable, because it is not especially reliable, but that when it fails it falls in a direction that stops traffic rather than a direction that invites a car onto the track.
The hazard is stated with that asymmetry built in: the crossing indicates clear to road while a train approaches. Everything else the equipment can do wrong is an inconvenience. The regime that owns this system classifies the hazard at SIL 4 and sets a tolerable hazard rate of 1 × 10⁻⁹ per hour, and the assessed design achieves 7 × 10⁻¹⁰ per hour. This page shows where those two numbers meet, and why a crossing with a failure rate two million times its own tolerable hazard rate is nonetheless a safe crossing.
The technique, and why this one
Failure-direction analysis: the failure rate is split into wrong-side and right-side branches, and only the wrong-side branch is carried into the hazard-rate demonstration. No general-purpose reliability model does this, because reliability has no notion of a direction. Every quantity below is either a wrong-side rate, a right-side rate, or the unavailability of a device whose job is to force a failure into the right-side branch.
| Quantity | Model | Value | What it is |
|---|---|---|---|
| Vital processor pair (2oo2) | exponential | 40 per 10⁶ h | fails to the safe side by design |
| Barrier drive unit, 2 fitted | Weibull, β = 1.9, η = 42,000 h | book value 300 per 10⁶ h each | mechanical, rising hazard |
| Axle counter | exponential | 120 per 10⁶ h | |
| Signal lamp unit, 4 fitted | exponential | 200 per 10⁶ h each | |
| Road loop detector | exponential | 80 per 10⁶ h | |
| Crossing power supply unit | exponential | 300 per 10⁶ h | |
| All failures, series total | 1,940 per 10⁶ h | the reliability answer | |
| Wrong-side share, before mitigation | 6 per 10⁶ h | the safety input | |
| Wrong-side share, after the vital architecture | 0.7 × 10⁻³ per 10⁶ h | the safety answer | |
| Barrier-down proving switch | λT/2, T = 2,160 h | λDU 0.9 per 10⁶ h | latent, proof tested at 90 days |
The barrier drive is modelled with a Weibull because the field returns say so, and the reasoning behind that fit belongs to the reliability page. The safety consequence of the shape is worked below, and it is not the one most engineers expect.
The direction split does all the work
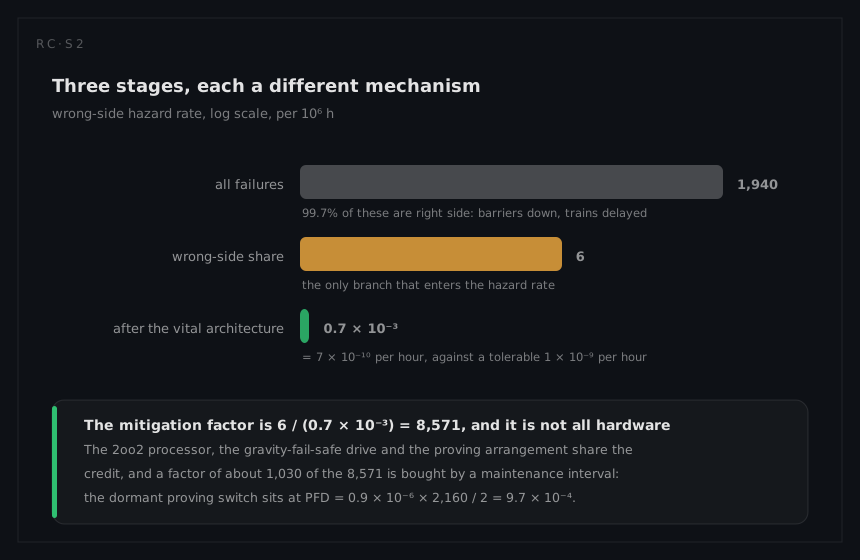
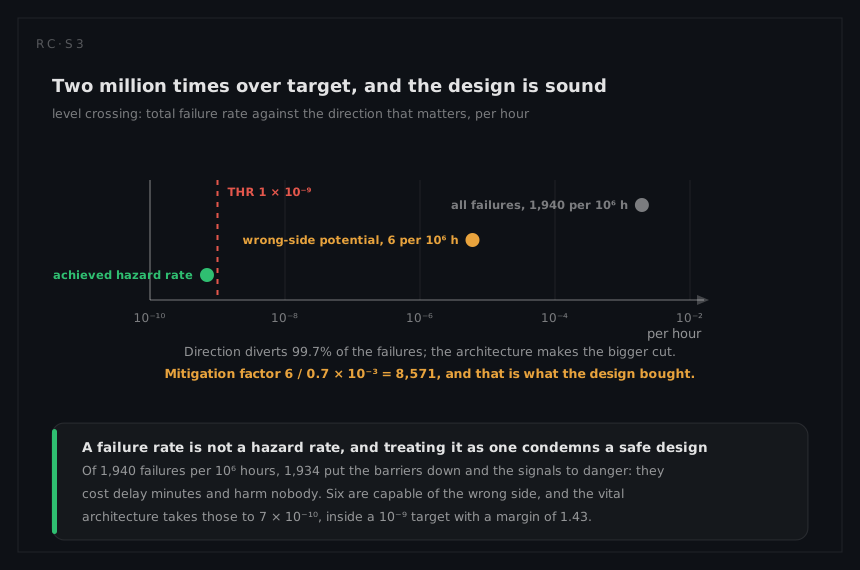
Start from the reliability answer and refuse to use it. The crossing runs at 1,940 per 10⁶ hours, which is 1.94 × 10⁻³ per hour. Set that beside the tolerable hazard rate of 1 × 10⁻⁹ per hour:
1.94 × 10⁻³ / 1 × 10⁻⁹ = 1.94 × 10⁶
Nearly two million times over target. A safety argument that took the failure rate as the hazard rate would condemn this design, and it would be wrong, because 1,934 of those 1,940 failures per 10⁶ hours put the barriers down, the road signal to danger and the train signal to red. They cost delay and nothing else.
The wrong-side share before mitigation is 6 per 10⁶ hours, that is 0.31 per cent of the total. The vital architecture, meaning the 2oo2 processor that must agree before the crossing may show clear, the fail-safe barrier drive that falls under gravity when its supply is lost, and the proving arrangement that confirms the boom is actually down, takes that to 0.7 × 10⁻³ per 10⁶ hours. Converting to the units the target is written in:
0.7 × 10⁻³ per 10⁶ h = 0.7 × 10⁻³ × 10⁻⁶ = 7 × 10⁻¹⁰ per hour
which is the achieved hazard rate exactly, inside the 1 × 10⁻⁹ target with a margin of 1.43. The SIL 4 demonstration is not a separate calculation; it is the wrong-side rate restated in the target's units. The mitigation factor is
6 / (0.7 × 10⁻³) = 8,571
about 8,600, and that factor, not the 1,940, is what the design bought.
Put the two branches into events a person can picture. At 8,760 hours a year across a fleet of 40 crossings, the right-side branch produces 1.94 × 10⁻³ × 8,760 = 17.0 failures per crossing-year and roughly 680 events a year across the fleet. The wrong-side branch produces 7 × 10⁻¹⁰ × 8,760 = 6.1 × 10⁻⁶ per crossing-year, and 2.5 × 10⁻⁴ per fleet-year, one event per 4,080 fleet-years. The design trades about 2.8 million right-side failures for every wrong-side one, and the price of that trade is paid in availability, where 680 events a year become 638 crossing-hours of degraded operation.
Where the rising hazard lands, and where it does not
With β = 1.9 the barrier drive's hazard climbs. At five years in service:
h(43,800) = (1.9 / 42,000) × (43,800 / 42,000)^0.9 = 4.52 × 10⁻⁵ × 1.039 = 4.7 × 10⁻⁵ per hour
that is 47 per 10⁶ hours. At ten years:
h(87,600) = (1.9 / 42,000) × (87,600 / 42,000)^0.9 = 4.52 × 10⁻⁵ × 1.938 = 8.8 × 10⁻⁵ per hour
88 per 10⁶ hours, against a fleet average of 26.8. An ageing drive is three and a quarter times as likely to fail in the next hour as the average suggests.
The safety reading is the surprising part. The rising hazard does not raise the wrong-side rate at all, because the direction a barrier drive fails in is set by gravity and by the proving switch, not by how worn the drive is. A tired drive fails by not lifting, by lifting slowly, or by dropping when it should stay up, and every one of those is right-side. What ageing buys is delay, which is why the age-replacement decision at B10 = 13,000 hours is argued in the reliability and maintainability columns rather than here.
The exception is the confirmation path, and that is where the trap sits.
The one term that is genuinely dangerous
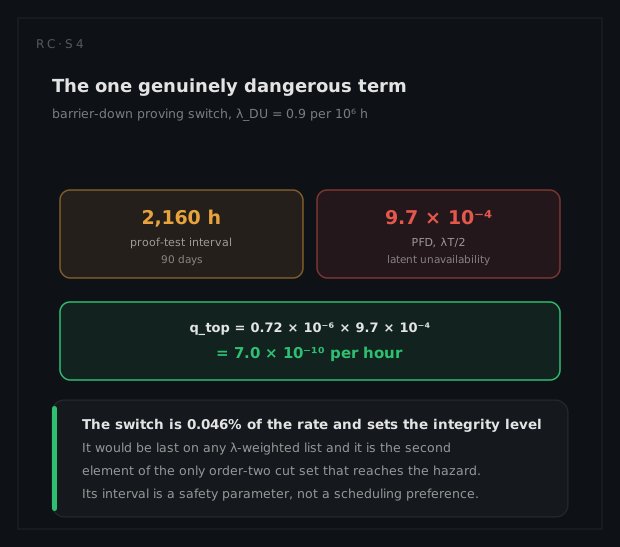
The wrong-side cut set that survives is a coincidence: the barrier fails to reach the down position, and the proving switch reports it down anyway. The first event is common. The second is the protection, and it is latent, so its contribution is an average unavailability rather than a rate:
PFD = λDU × T / 2 = 0.9 × 10⁻⁶ × 2,160 / 2 = 0.9 × 10⁻⁶ × 1,080 = 9.7 × 10⁻⁴
The switch is therefore dead for an average of half its 90-day test interval, and on that branch it supplies a factor of 1/9.7 × 10⁻⁴ = 1,030. That is a large share of the 8,600 the architecture claims, delivered by a proof-test interval rather than by hardware.
Notice how the term behaves. PFD is linear in T, so a 30-day interval gives 0.9 × 10⁻⁶ × 360 = 3.2 × 10⁻⁴, three times better, and an annual interval gives 0.9 × 10⁻⁶ × 4,380 = 3.9 × 10⁻³, four times worse. The integrity of this crossing is set by a maintenance schedule, and 9.7 × 10⁻⁴ is a startling number to leave loose inside an argument targeting 10⁻⁹. It is tolerable only because it appears in a cut set alongside a barrier that has already failed, and establishing that a term is a confirmation rather than a barrier is exactly the cut-set work described in the systems chapter.
The same cut set, drawn
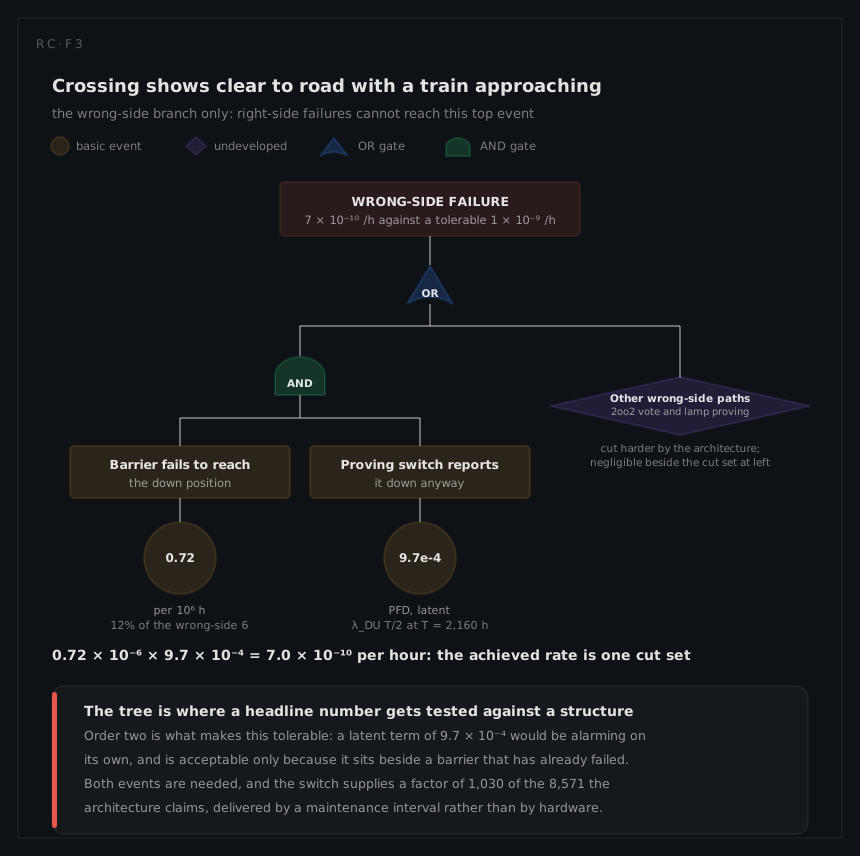
The direction split produces a rate. It does not produce a structure, and the SIL 4 argument needs both, because a tolerable hazard rate is a necessary condition and freedom from single-point failure is a separate one. A fault tree is where the second gets demonstrated.
The top event is the hazard as stated: the crossing indicates clear to road while a train approaches. Beneath it an OR separates the paths that can reach it. The dominant one is an AND of two events that have to coincide:
qtop = λ(barrier not down) × PFD(proving switch) = 0.72 × 10⁻⁶ × 9.7 × 10⁻⁴ = 7.0 × 10⁻¹⁰ per hour
which is the achieved rate exactly, so the tree closes on one cut set. Read backwards, that fixes the first term: the barrier-not-down branch must carry 0.72 per 10⁶ hours, which is 12 per cent of the 6 per 10⁶ hour wrong-side population. The other 88 per cent runs through paths the 2oo2 vote and the lamp proving cut far harder, which is why they sit under an undeveloped diamond rather than being expanded. Assigning the whole achieved rate to the dominant cut set and asking what each branch must then carry is the cheapest sanity check available on a headline number, and it is only possible once the tree exists.
Two findings come out of the structure that the rate alone cannot give.
There is no order-one cut set. No single failure of this crossing produces a permissive indication. That is the property a SIL 4 claim rests on, and the tree demonstrates it by inspection rather than by arithmetic, which matters because a structural claim survives a change of failure-rate data and a numerical one does not.
The AND gate is a promise about independence, and it is the fragile part. The barrier drive and the proving circuit must not fail from the same cause. Share a power supply between them and the AND collapses towards an OR; run the proving wiring in the same loom as the drive and a single chafe defeats both; let one technician adjust the drive and then verify it with the switch he has just disturbed and the coincidence stops being a coincidence. None of that appears in the 7 × 10⁻¹⁰. It appears in the common cause analysis, which is the argument that the multiplication was allowed at all.
What the analysis tells the engineer to do
Do not optimise the 1,940. A programme that reduced total failure rate without attending to direction can easily make the 0.7 × 10⁻³ worse, because most of the mechanisms that force a failure to the safe side are mechanisms that make failures more frequent: the vote that refuses to show clear unless both processors agree, the drive that drops on loss of supply, the lamp proving that declares a crossing failed on one dark filament.
Write the 90-day proving-switch test into the maintenance contract as a safety requirement, tracked, with a missed test raising an event through FRACAS. A SIL claim resting on a test interval is void the moment the interval slips, and no document will notice.
Be careful with the 78 per cent remote condition monitoring coverage. It is 78 per cent of the total failure rate, which is a maintenance figure. The safety-relevant question is what fraction of the 0.7 × 10⁻³ wrong-side branch is revealed, and coverage measured against the wrong denominator is one of the commonest ways a safety case quietly stops being true. The testability page separates the two.
What a different technique would have given
Suppose the crossing had been assessed with a conventional quantitative risk assessment driven by the system failure rate, the technique that serves almost every other machine in this chapter. It would take 1,940 per 10⁶ hours, produce 17 hazardous events per crossing-year and 680 across the fleet, place the design nearly two million times above its tolerable hazard rate, and demand a redesign that no achievable component quality could deliver: getting 1,940 down to 10⁻⁹ per hour is not an engineering programme, it is a fantasy. The design would then be improved in exactly the wrong direction, by removing the fail-safe mechanisms that generate most of the failures.
A risk-graph SIL determination is the other plausible alternative and it fails differently. It would land on SIL 4, correctly, by reading off consequence, occupancy, avoidance and demand rate, and it would hand the designer a target with no quantity attached. There would be no wrong-side rate to demonstrate against, no way to price the 90-day proof-test interval, and no way to notice that a single latent switch is carrying a factor of a thousand. A classification tells you how hard the problem is; only the direction split tells you whether you have solved it.