

Four reaction wheels of which three are needed, two star trackers, three magnetorquers and an onboard computer with a cold spare, seven years in orbit. Nobody will ever open this machine. There is no wrench, no spare on a shelf, no technician and no second attempt, and the maintainability programme still has to mean something, because the spacecraft does recover from failures and something has to be designed to make that possible.
What replaces the repair is a ground action: telemetry reveals an anomaly, an operations team works out what happened, a new wheel assignment is uplinked and confirmed, and the spacecraft resumes in a degraded pointing mode. That sequence has a duration, a spread and a probability of not completing, which is enough to build a maintainability model on. It is also the one system in this chapter whose maintainability function does not reach one.
The technique, and why this one
A three-stage restoration timeline, each stage modelled as a lognormal, combined by moment matching into a single restoration distribution, then truncated by the fraction of failures telemetry can never reveal. Nothing else is available. Elemental task analysis in the hangar sense is meaningless when preparation, disassembly, interchange and reassembly are all identically zero; what survives from the corrective chain is localization, isolation, decision and one irreversible action, timed as operations stages rather than bench tasks.
| Restoration stage | Model used | Parameter | Share of the mean |
|---|---|---|---|
| Detect the anomaly from telemetry | lognormal, σ = 0.7 | tmed = 40 min | 12% |
| Diagnose and decide | lognormal, σ = 0.7 | mean 4 h | 54% |
| Uplink and confirm the new assignment | lognormal, σ = 0.7 | mean 2.5 h | 34% |
| Combined restoration | moment-matched lognormal | mean 7.35 h, σ = 0.49 | |
| Detectability ceiling | Bernoulli truncation | 96% telemetry coverage | |
| Second attempt | none exists |
The σ = 0.7 on each stage is this chapter's canonical spread and an assumption rather than a fitted value. The combined σ that falls out of it is not, and it is the interesting number.
Adding three stages, and the error hiding in the sum
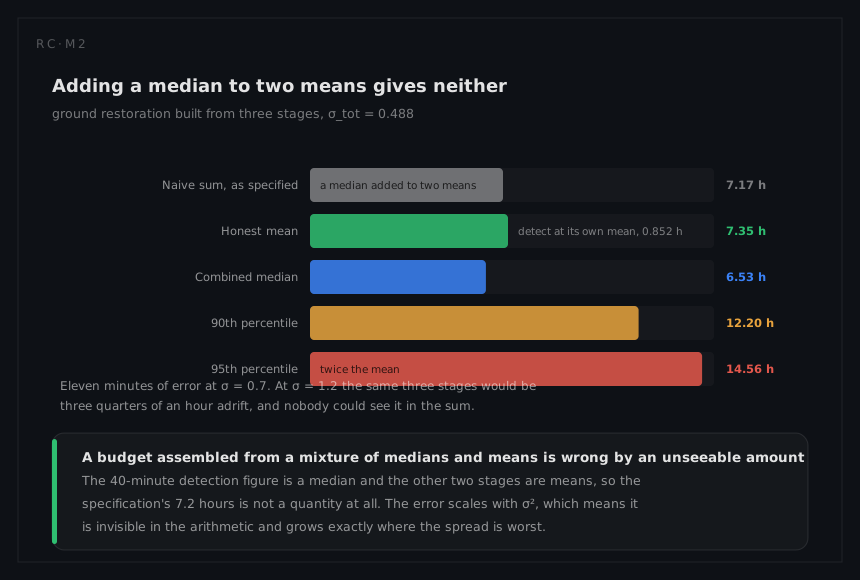
The specification quotes a mean restoration of 7.2 hours, which is what adding the three stage figures as stated produces:
0.667 + 4 + 2.5 = 7.167 h
That addition contains the commonest mistake in restoration-time bookkeeping. The 40 minutes for detection is a median, and medians do not add inside a sum of means. For a lognormal with σ = 0.7,
mean = tmed × e^(σ²/2) = 40 × e^0.245 = 40 × 1.2776 = 51.1 min = 0.852 h
so the honest total is 0.852 + 4 + 2.5 = 7.35 h. Eleven minutes, which on this system is not worth arguing about. The reason to do the arithmetic anyway is that the error scales with σ²: at σ = 1.2 the same 40-minute median carries a mean of 82 minutes and the total becomes 7.87 hours, three quarters of an hour adrift of the naive sum. A restoration budget assembled from a mixture of medians and means is wrong by an amount nobody can see without knowing each stage's spread.
Detection's own tail is worth a moment, since it is the stage the design most directly controls. Its 90th percentile is 40 × e^(1.282 × 0.7) = 98 minutes and its 95th is 40 × e^(1.645 × 0.7) = 127 minutes, so one anomaly in twenty sits unnoticed for over two hours while the spacecraft is off-pointing.
What the combined distribution says
Stages add, but their distribution must be built rather than assumed, because a sum of lognormals is not lognormal. Add means and variances and moment-match, with each stage's variance given by
Var = mean² × (e^(σ²) − 1) = mean² × 0.6323
| Stage | Mean (h) | Variance (h²) |
|---|---|---|
| Detect | 0.852 | 0.459 |
| Diagnose and decide | 4.0 | 10.117 |
| Uplink and confirm | 2.5 | 3.952 |
| Total | 7.352 | 14.528 |
The standard deviation is √14.528 = 3.81 hours, the coefficient of variation is 3.81 / 7.35 = 0.518, and the matched parameters are
σtot = √ln(1 + 0.518²) = √0.238 = 0.488
tmed = 7.352 / e^(0.488²/2) = 7.352 / 1.1264 = 6.53 h
t₀.90 = 6.53 × e^(1.282 × 0.488) = 6.53 × 1.869 = 12.20 h
t₀.95 = 6.53 × e^(1.645 × 0.488) = 6.53 × 2.231 = 14.56 h
Two results deserve care. The combined σ of 0.488 is well below the 0.7 assumed for each stage, which is the central-limit effect: adding independent stages tightens the relative spread, so a three-stage sequence is inherently more predictable than any of its parts. And the 95th percentile is 14.6 hours against a mean of 7.35, so a ground team rehearsed against the mean has rehearsed against half of its bad day.
The maintainability function that never reaches one
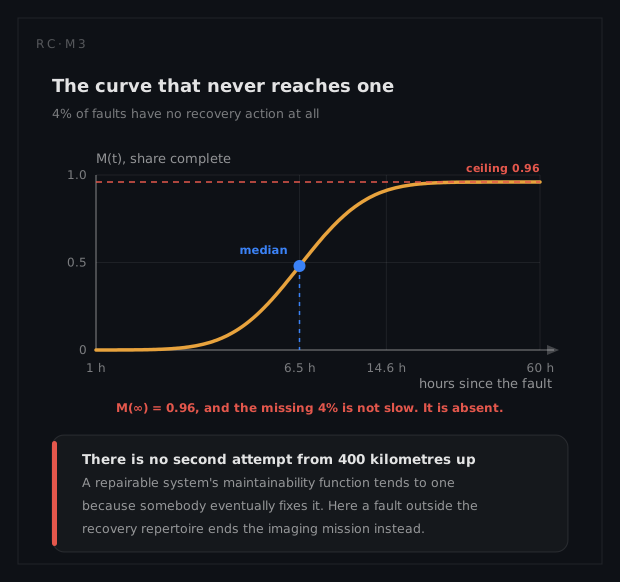
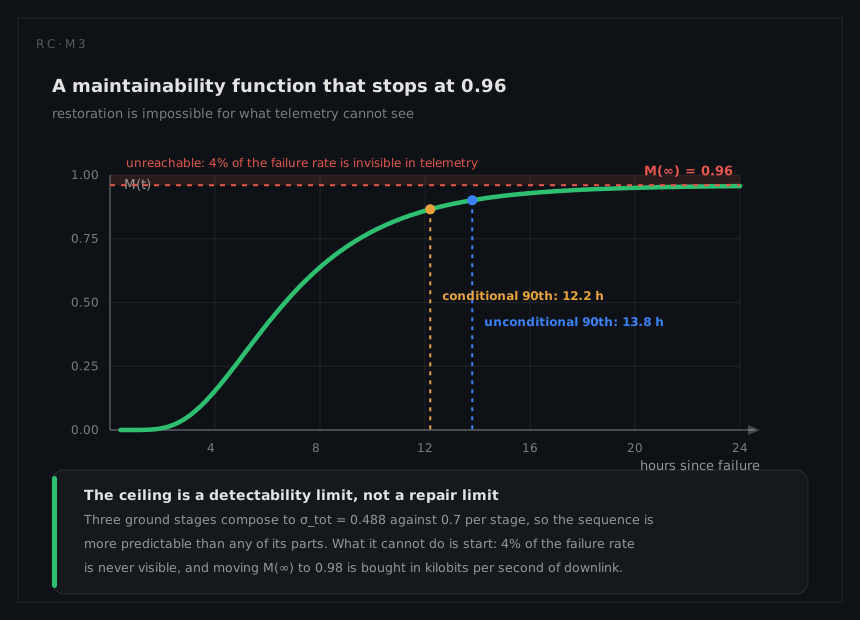
Telemetry coverage is 96% of the failure rate, and the reason is structural rather than budgetary: anything not observable in telemetry is permanently undiagnosable, because no other test access will ever exist. That puts a ceiling on the maintainability function,
M(∞) = 0.96
which no terrestrial system in this chapter can say. Restoration is possible for 96% of failures and impossible for the rest at any elapsed time whatever. Folding the ceiling in gives
M(t) = 0.96 × Φ(ln(t / 6.53) / 0.488)
The unconditional 90th percentile needs Φ = 0.90 / 0.96 = 0.9375, so z = 1.534 and t₀.90 = 6.53 × e^(1.534 × 0.488) = 13.8 hours, up from 12.2. The 95th needs Φ = 0.9896, giving t₀.95 = 20.2 hours. And there is no 97th percentile at all: Mmax(97%) does not exist, because four failures in a hundred are never restored. A specification asking for one would be asking for something the mission forbids, and the honest response is to move the argument from the time axis to the coverage axis, where the 4% is a downlink budget decision.
Restored to what, and what the answer costs
The 7.2 hours restores attitude control, not the mission. A safe-mode entry costs 18 hours before imaging resumes and there are 2.5 a year, which the availability analysis prices at 1.03% of imaging availability against an operational figure of 0.983 for the imaging service. The operator's clock therefore runs 18 / 7.2 = 2.5 times as long as the engineer's for the same event.
Defining the end state of a restoration is a maintainability decision, and here two defensible definitions differ by a factor of two and a half. Rehearsal, procedure and decision authority have to be designed for the longer one. The spares position, by contrast, was settled at build: the fourth reaction wheel is the spare, carried on board because no other pipeline exists, and the level-of-repair analysis behind that had exactly one opportunity to be right.
What the analysis tells the engineer to do
Spend the diagnostic hours deliberately and do not compress them. With no second attempt the governing requirement is not a duration but a correctness probability: P(the uplinked reconfiguration is the right one). Independent review before commitment adds time to the 4-hour stage and reduces the chance of an irreversible mistake, and that trade is worth taking. Slower is frequently the right maintainability answer here, the opposite of the instinct every other row rewards.
Buy coverage with downlink bandwidth. Housekeeping telemetry is 4% of the total downlink budget, and that budget, not the ground software, caps coverage at 96%. Moving M(∞) to 0.98 halves the permanently unrecoverable population and is bought in kilobits per second. The testability page works the coverage argument; on this system testability is maintainability, with no intervening hardware.
Design the procedures as the maintainable article. With no fasteners or connectors to improve, the levers in the design chapter reduce to those that compress localization and decision: rehearsal on a ground model, pre-authorised contingency branches, and a telemetry set arranged so the failure signature is unambiguous rather than merely present.
What a different technique would have given
The conventional answer would be a duration specification: an MTTR of 7.2 hours with an Mmax(95%) commitment, which this page has now computed at 14.6 hours conditional on detection and 20.2 unconditional. Both numbers are sound and both are the wrong instrument. A percentile is a statement about a population of repeated actions, and this system performs one action per anomaly with no repetition and no recovery from a bad one.
The arithmetic makes the danger concrete. Halve the diagnose-and-decide stage from 4 hours to 2 and the combined mean falls to 5.35 hours, the standard deviation to 2.63 and the matched σ to 0.466, putting the median at 5.35 / e^(0.466²/2) = 4.80 hours and the percentile at
t₀.95 = 4.80 × e^(1.645 × 0.466) = 4.80 × 2.152 = 10.33 h
A duration specification would record that as a 29% improvement and reward it. What it actually bought was two fewer hours of thinking before an irreversible uplink, on a spacecraft with no way to undo a mistaken one. The technique was rejected not because its numbers are wrong but because optimising them makes the system worse, which is the only reason worth rejecting a technique for.