

Consider the pitch-control drive card of a wind turbine: the power and control electronics that hold each blade at the commanded angle and feather it when the turbine has to stop. It is deliberately none of the systems the industry examples carry, and its numbers belong to no source. Every value below is an illustrative teaching figure; the arithmetic and the column definitions are MIL-STD-1629A's.
The ground rules, settled before the first row:
| Ground rule | This analysis |
|---|---|
| Indenture levels | Part → card → pitch axis → turbine |
| Approach | Piece-part, from the card's parts list |
Exposure t | 8,760 hours, one turbine-year: the pitch system is energised whenever the turbine is |
| Severity | Classified on the end effect at turbine level, with compensating provisions removed |
| α source | Part-family mode distributions, replaced by field returns where the fleet has them |
| λp source | The parts-count prediction for this card |
The card predicts at 38.3 failures per 10⁶ hours, an MTBF of 26,110 hours, distributed over eight items:
| Item | λp per 10⁶ h | Share of the card |
|---|---|---|
| V1 · IGBT module | 12.0 | 31.3% |
| C1–C4 · DC-link electrolytic bank | 9.6 | 25.1% |
| U1 · microcontroller | 5.0 | 13.1% |
| U5 · resolver interface | 4.5 | 11.7% |
| U2 · gate-drive IC | 3.2 | 8.4% |
| PCB · board and solder joints | 2.0 | 5.2% |
| X1 · 24-way connector | 1.2 | 3.1% |
| R7 · current-sense resistor | 0.8 | 2.1% |
Task 101: the modes and what follows from them
The worksheet is 22 rows, one per mode-and-effect pair. Six of them carry the analysis:
| Item · mode | Local effect | End effect at the turbine | Detection | Sev |
|---|---|---|---|---|
| U5 · plausible but wrong angle | angle reported wrong by up to 8° | blade pitched to the wrong angle, rotor overspeed on a gust | none: the value passes every range check | I |
| C1–C4 · short | converter shoot-through | drive destroyed, blade stuck at the last angle | none before the event | I |
| U1 · erroneous output, undetected | wrong pitch command issued | blade driven off the commanded angle | none: no independent check of the command | I |
| U2 · output stuck high | shoot-through in one leg | uncommanded torque on the pitch axis | none before the event | I |
| V1 · short-circuit | leg fails, drive trips | blade held at the last angle, turbine stops | desaturation detect | II |
| C1–C4 · ESR drift | ride-through shortens | pitch rate falls, turbine derates | DC-link ripple trend | III |
Two things are already visible without any arithmetic. Every Class I row's detection column says "none", and the reason is the same in each case: these are the modes where the card keeps working and reports something false. And the item with the largest failure rate on the card, the IGBT at 31.3 per cent, does not appear in the Class I list at all: its modes stop the turbine, which is expensive and safe.
Task 102: the criticality numbers
Each row gains four values and produces one. The resolver's dangerous mode, in full:
Cm = β · α · λp · t = 0.5 × 0.20 × 4.5 × 10⁻⁶ × 8,760 = 3.94 × 10⁻³ per turbine-year
The α of 0.20 says a fifth of the resolver interface's failures present as a plausible wrong angle rather than as a dead signal; the β of 0.5 says that when that happens, the wrong angle produces an overspeed event about half the time, the other half being caught by wind conditions that make it harmless. The four Class I rows:
| Mode | α | λm = α·λp | β | Cm |
|---|---|---|---|---|
| C1–C4 · short | 0.10 | 0.96 | 0.50 | 4.20 × 10⁻³ |
| U5 · plausible wrong angle | 0.20 | 0.90 | 0.50 | 3.94 × 10⁻³ |
| U1 · erroneous output | 0.15 | 0.75 | 0.40 | 2.63 × 10⁻³ |
| U2 · output stuck high | 0.25 | 0.80 | 0.30 | 2.10 × 10⁻³ |
| Class I total | 1.29 × 10⁻² |
Item criticality is the sum within a class, so those four numbers are also the four items' Cr in Class I. Across all four classes:
| Class | Total Cr per turbine-year | Dominated by |
|---|---|---|
| I · catastrophic | 1.29 × 10⁻² | the capacitor bank, 32.7% of the class |
| II · critical | 4.97 × 10⁻² | V1, the IGBT, 86.7% of the class |
| III · marginal | 2.92 × 10⁻² | the capacitor bank's ESR drift, 79.1% of the class |
| IV · minor | 0 | the three nuisance-trip modes, all at β = 0 |
One Category I event every 78 turbine-years, which on a 200-turbine farm is 2.6 a year and is the number the operator will eventually experience. Class IV coming out at zero is not an error: those modes produce spurious trips and no damage, so their β against a damaging end effect is zero. They still cost money, and that cost is Task 103's problem rather than criticality's.
What the two rankings disagree about
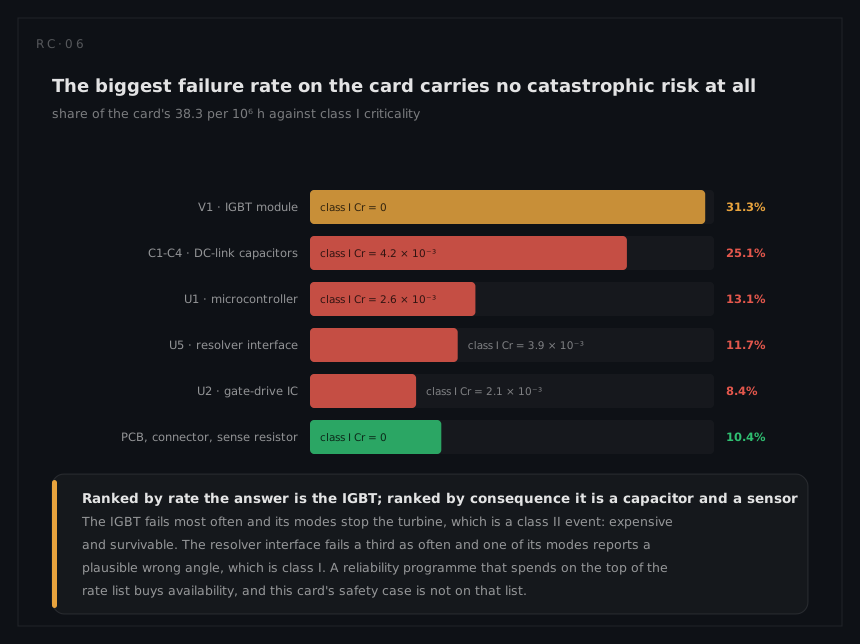
Ranked by failure rate the answer is the IGBT, then the capacitors, then the microcontroller. Ranked by Class I criticality it is the capacitors, the resolver interface, the microcontroller and the gate drive, and the IGBT is not on the list. Both rankings are correct and they are answering different questions: the first is where the turbine's downtime comes from, the second is where its hazard comes from. A programme that spends its budget on the top of the rate list buys availability and leaves the safety case untouched.
The finding that pays for the analysis
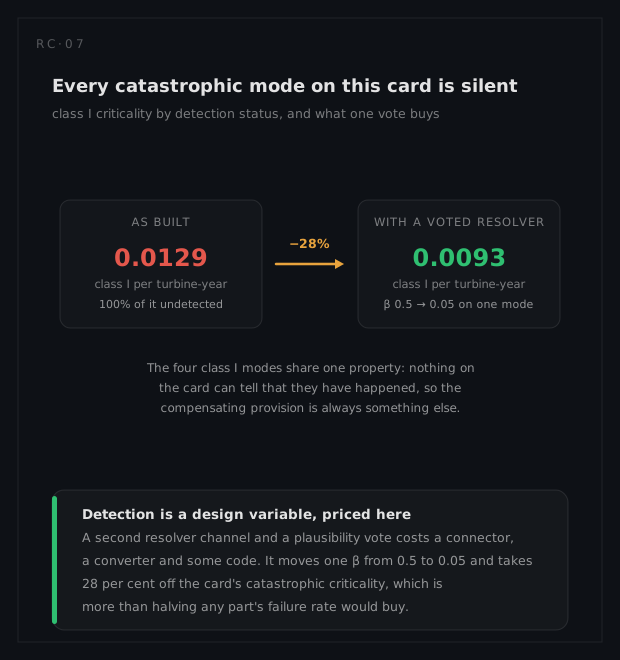
One hundred per cent of the Class I criticality sits in modes with no detection. That is not a coincidence and it is the general shape of the result: a mode that announces itself gets a compensating provision, and what remains is what the card cannot see. The four modes have the same character, which the testability page calls the same thing: the item continues to operate and reports something false.
The design action falls out of the number. Adding a second resolver channel and voting the two for plausibility moves that mode's β from 0.5 to about 0.05, because a wrong angle now has to survive a comparison to reach the controller:
| Class I criticality per turbine-year | |
|---|---|
| As built | 1.29 × 10⁻² |
| With a voted second resolver channel | 0.93 × 10⁻² |
A 28 per cent cut in the card's catastrophic criticality for a connector, a converter and some code, which is more than halving the failure rate of any part on the card would deliver. That comparison is the argument for doing Task 102 rather than stopping at Task 101: the qualitative worksheet identifies the mode, and only the arithmetic says what fixing it is worth against everything else on the list.
Task 103, on the same rows
The maintainability reading uses the worksheet already written and adds three columns:
| Mode | How it is isolated | What comes off | Time |
|---|---|---|---|
| V1 · short-circuit | desaturation flag names the leg | the whole card | 3.5 h, one tower visit |
| C1–C4 · ESR drift | ripple trend, weeks of warning | the card, on a planned visit | 3.5 h, no lost production |
| X1 · intermittent contact | not isolated: the trip log is ambiguous | often the wrong card first | 3.5 h, twice |
The third row is the one worth reading. An intermittent connector is a Class IV mode with a criticality of zero and a maintenance cost that exceeds several Class III modes together, because it produces repeat visits to a nacelle. Criticality ranks hazard, not cost, and Task 103 is where the second ranking gets built, feeding maintainability and the spares case rather than the safety case.
Task 104, and why this analysis does not have one
Damage mode and effects analysis asks what a stated threat does to each item: a fragment, a blast overpressure, a directed-energy exposure. A wind turbine has no threat specification, so Task 104 is marked not applicable, with that reason recorded, which is the honest treatment. Had this been a naval or airborne installation, the same eight items would be re-analysed against a damage mechanism rather than a failure mode, and the answer would not resemble the criticality ranking above: the resolver interface is a small part in a protected housing and the DC-link capacitor bank is a large one that fragments, so the rankings invert. That inversion is the reason the task exists as a separate analysis rather than as another column.