

A FRACAS has three technical foundations: the record, the classification rules that decide what counts, and the arithmetic that decides whether a corrective action worked. Everything else is process.
The record, and the fields that make it analysable
A failure report is written once, by somebody who wants to get back to work, and read years later by somebody computing a rate. The fields that matter are the ones that cannot be reconstructed afterwards:
| Field | Why it cannot be added later |
|---|---|
| Item identity and configuration | Which build standard, which serial, which software version |
| Operating time or cycles at failure | The denominator of every rate; nobody remembers it in March |
| Environment and duty at the time | Whether this is the cold-start population or the continuous one |
| Symptom, verbatim | The analyst's later hypothesis must not overwrite what was seen |
| What was done, and what was replaced | Distinguishes a repair from a swap-until-it-works |
| Verification result | Whether the item was confirmed failed on the bench |
Two of those deserve emphasis because they are the two most often missing. Operating time at failure turns a count into a rate, and a system without it can produce a Pareto chart and nothing else. And the verbatim symptom is what allows a later analyst to re-classify a report when the understanding changes, which happens on every programme that lasts.
Classification, which decides the answer
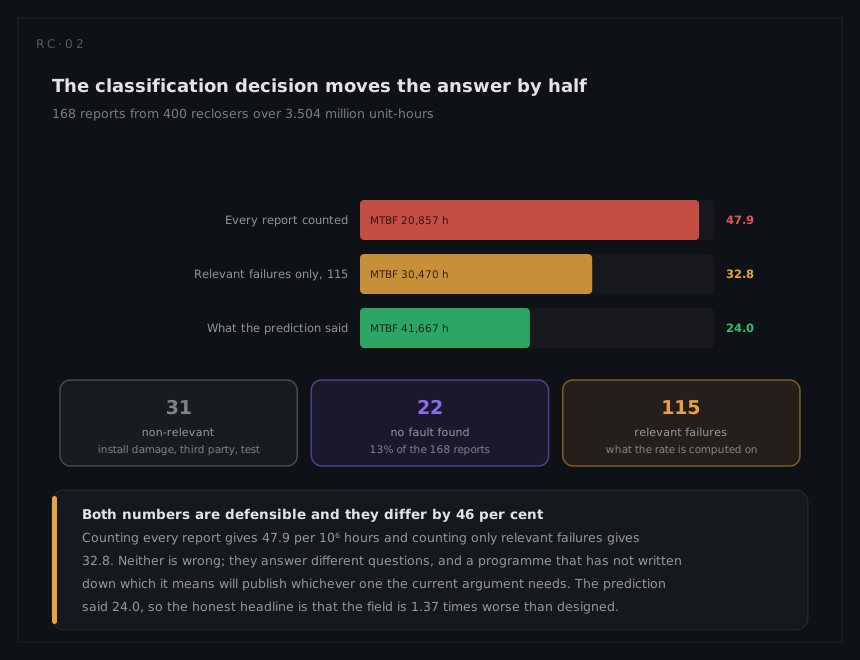
Every report gets classified twice, and both decisions move the numbers:
Relevant or not. A relevant failure is one that counts against the equipment's reliability: a genuine failure of the item, under conditions it was specified for. Non-relevant covers installation damage, third-party action, test-induced failures, and operation outside the specification. The rule has to be written down before the data arrives, because afterwards every classification is an argument with a number attached.
Chargeable or not, which is the contractual cousin: whether this failure counts against a demonstrated MTBF or a warranty claim. Relevance is engineering, chargeability is commercial, and conflating them is how a reliability programme ends up negotiating its own data.
Three more distinctions do real work:
| Distinction | Why it matters |
|---|---|
| Primary or secondary | A failure caused by another failure is not a second data point for its own item |
| Induced | Caused by an external event or by maintenance itself; a large category nobody expects |
| No fault found | Not a failure of the item, and not nothing: it is a diagnostic failure, and it belongs to testability |
Root cause, and the second question
The analysis step has two questions and most systems ask only the first.
Why did it fail? The physical or logical cause: a seal that hardened, a watchdog that fired on a supply dip, a bearing that spalled. Structured methods apply, and which one hardly matters: five whys, a cause-and-effect diagram, or a small fault tree built downward from the observed event. What matters is stopping at a cause somebody can act on rather than at one that merely sounds explanatory.
Why did we not catch it? The escape: the analysis that should have predicted this mode, the test that should have found it, the review that should have caught the design. A programme that only ever answers the first question fixes each failure and keeps the process that produced it, which is why the same class of finding reappears on the next product.
Proving the action worked
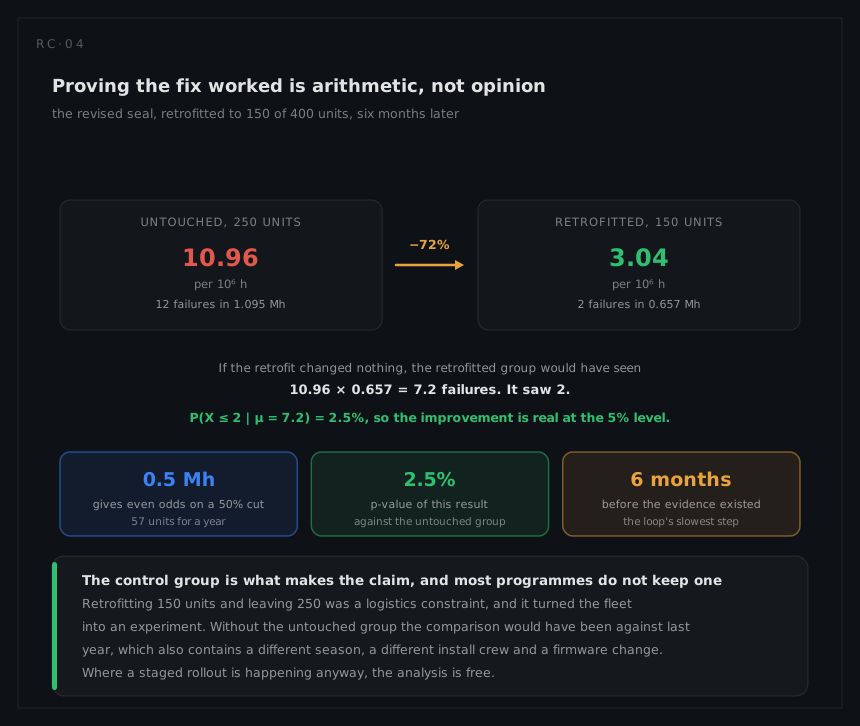
This is the arithmetic that turns a corrective action into a closed one. Given a before-rate λ₀, the observed count k in the exposure T afterwards is compared with what λ₀ would have produced:
μ = λ₀ · T, and the evidence is P(X ≤ k | μ) = e^(−μ) Σ μⁱ/i! for i = 0 … k
A small probability means the reduction is unlikely to be luck. The best comparison is not against the past but against an untouched part of the same fleet over the same period, because a staged retrofit turns the rollout into a controlled experiment: same season, same crews, same firmware.
The same expression run backwards answers the question programmes ask too late: how much exposure is needed before an improvement can be claimed at all. Take a rate of 11 per 10⁶ hours that a fix genuinely halves. In half a million unit-hours an unchanged item would produce 5.5 failures, so clearing a 90 per cent bar means observing two or fewer; a halved item expects 2.75, so it clears that bar roughly half the time. Half a million hours is where the demonstration becomes a coin toss, not where it becomes reliable: budget nearer 1.5 million unit-hours for a four-in-five chance of proving a halving that is genuinely there. Even the coin-toss exposure is under two months on a 400-unit fleet and nearly five years on a fleet of twelve, and on the fleet of twelve the corrective action will be closed on faith.
The loop's own measures
A FRACAS is a process, and a process that is not measured stops. Everything in this section comes from one piece of bookkeeping: the state each report is in, and the date it entered that state. A report moves through raised, verified, analysed, action assigned, action verified, closed, and once those transitions carry dates, four numbers say whether the loop is alive:
| Measure | What it detects |
|---|---|
| Closure rate | Whether reports are being worked at the rate they arrive |
| Backlog age | Whether the queue is being served or accumulating |
| Count beyond a threshold age | Whether the hard reports are being avoided; they hold the root causes worth having |
| Recurrence after closure | The rate at which the loop declared victory and was wrong |
The last one is the sharpest, and it is the one almost nobody computes. A closure rate of 90 per cent with a recurrence rate of 15 per cent describes a system that is clearing its queue by closing things that are not fixed.