

Consider a distribution utility's fleet of 400 pole-mounted reclosers: the automatic switchgear that clears a transient fault on an overhead line and recloses, spread across a region and reported on by field crews who are not reliability engineers. One year of operation, 3.504 million unit-hours. Every value is an illustrative teaching figure; the arithmetic is the standard's.
What arrived, and what counted
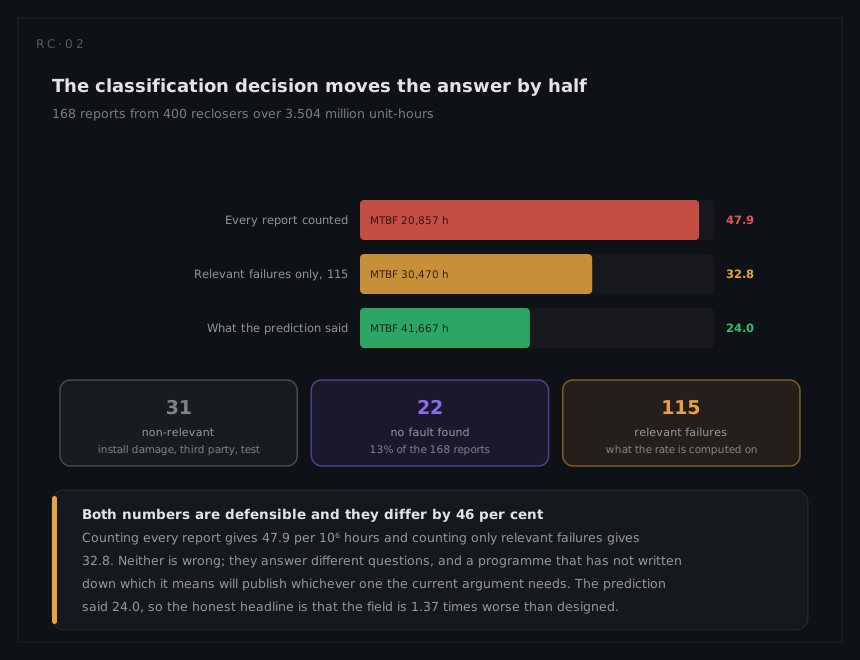
168 reports were raised. Classified against the rules written at the start of the programme:
| Class | Count | What they were |
|---|---|---|
| Relevant failures | 115 | Genuine failures of the recloser under specified conditions |
| No fault found | 22 | Returned, tested good on the bench |
| Non-relevant | 31 | Installation damage, third-party contact, test-induced |
λ over all 168 reports = 168 ÷ 3.504 = 47.9 per 10⁶ h, MTBF 20,857 h
λ over the 115 relevant = 115 ÷ 3.504 = 32.8 per 10⁶ h, MTBF 30,470 h
the prediction said 24.0 per 10⁶ h, MTBF 41,667 h
Counting every report overstates the rate by 46 per cent. Both numbers are defensible and they answer different questions: the first is what the maintenance organisation experiences, the second is what the equipment does. The honest headline needs both, and the comparison that matters is the second against the prediction: the fleet is running 1.37 times worse than designed.
A ratio built on a point estimate is not yet a grade. The 90 per cent interval around a count of 115 is approximately λ̂ (1 ± 1.645/√115), which is 28 to 38 per 10⁶ h: the predicted 24.0 falls below the bottom of it, so the shortfall is real rather than a bad year. That check is worth running before the ratio is quoted, because it is not always survivable. The same 1.37 measured on a fleet that produced a dozen relevant failures would carry a lower bound near 19 per 10⁶ h, below the prediction, and nothing could be claimed from it at all. At counts that small the 1 ± 1.645/√n shortcut is no longer safe (it puts that bound at 17, some 10 per cent low) and the exact Poisson limits are the ones to quote; at 115 the two agree to the rounding.
The 22 no-fault-found reports are not discarded. They are 13 per cent of the 168 reports raised, which is a diagnostic result rather than a reliability one, and it goes to the testability model.
Where the failures are
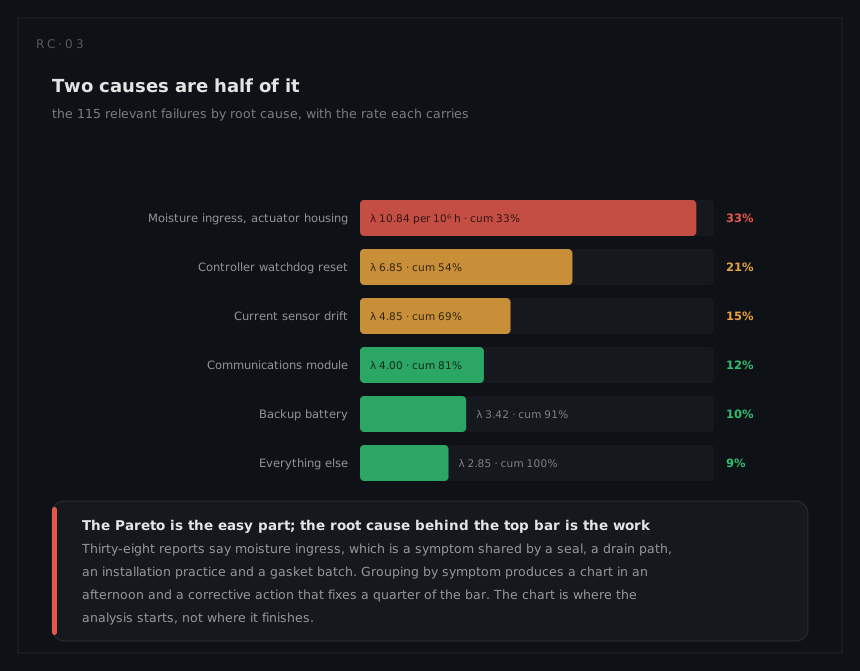
| Cause | Count | Share | Cumulative | λ per 10⁶ h |
|---|---|---|---|---|
| Moisture ingress, actuator housing | 38 | 33% | 33% | 10.84 |
| Controller watchdog reset | 24 | 21% | 54% | 6.85 |
| Current sensor drift | 17 | 15% | 69% | 4.85 |
| Communications module | 14 | 12% | 81% | 4.00 |
| Backup battery | 12 | 10% | 91% | 3.42 |
| Everything else | 10 | 9% | 100% | 2.85 |
The top bar is where the analysis begins. "Moisture ingress" is a symptom that four different causes produce: a seal compound that hardens below −15 °C, a drain path that the mounting angle defeats, an installation practice that leaves the gland loose, and one gasket batch. Teardown of eleven returned units found the first two accounted for 29 of the 38.
And the second question. Why did no analysis predict this? The FMECA carried "seal degradation" at α = 0.05, because the analyst had no field data and the mode looked minor. The environment the seal actually sees, a daily thermal cycle through zero with driven rain, was not in the derating analysis at all, because moisture is not a stress ratio. Both are escapes, and both are corrections to the way the next product is analysed rather than to this one.
The corrective action, and the proof
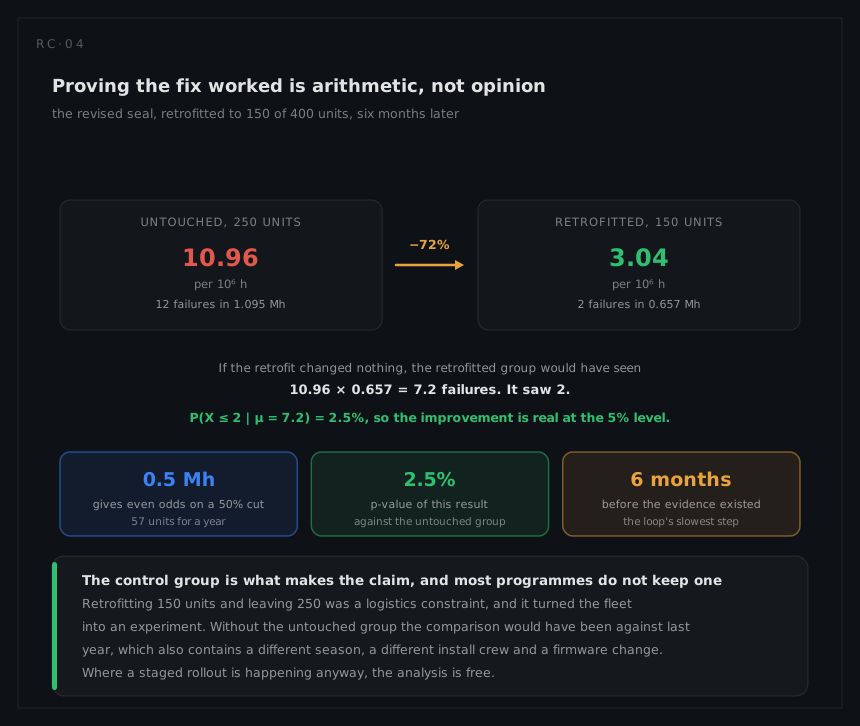
A revised seal compound and an added drain path were retrofitted to 150 units in month 7, limited by crew availability. The remaining 250 were untouched, which turned the rollout into a controlled comparison over the following six months:
| Population | Unit-hours | Moisture failures | λ per 10⁶ h |
|---|---|---|---|
| Untouched, 250 units | 1.095 M | 12 | 10.96 |
| Retrofitted, 150 units | 0.657 M | 2 | 3.04 |
An apparent 72 per cent reduction, which is where most programmes stop. The test:
μ = 10.96 × 10⁻⁶ × 657,000 = 7.2 failures expected if nothing had changed
P(X ≤ 2 | μ = 7.2) = e^(−7.2) (1 + 7.2 + 25.92) = 2.5 per cent
The improvement is real at the 5 per cent level, and the action can be closed with evidence rather than with a date. Had the retrofit reached only 40 units, the same 72 per cent reduction would have produced μ = 1.9 and a p-value near 15 per cent: the same physics, the same seal, and no basis for the claim.
Running the arithmetic forward is what a programme should do before the retrofit. At the untouched rate of 10.96 per 10⁶ h, 0.5 million unit-hours is where a genuine 50 per cent cut first stands an even chance of being demonstrated at 90 per cent confidence: 5.5 failures expected if nothing changed, so the bar is two or fewer, and a halved rate expects 2.75. That is 57 units for a year or the whole fleet for under two months, and roughly three times as much again before the demonstration is likely rather than a coin toss. What this retrofit had was 0.657 million hours, which cleared the bar only because the cut was far deeper than half. Those numbers decide whether the action can be proved at all on this fleet, and they are knowable on the day the action is written.
What the year hands back
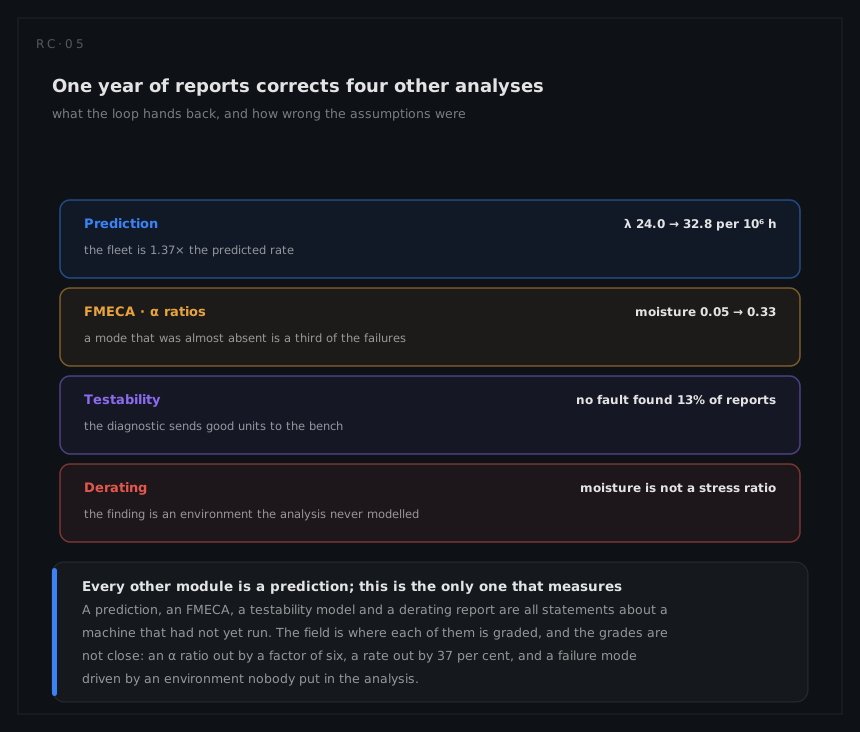
| Analysis | Was | Is | Factor |
|---|---|---|---|
| Prediction, fleet rate | 24.0 per 10⁶ h | 32.8 | 1.37× |
| FMECA, α for moisture ingress | 0.05 | 0.33 | 6.6× |
| FMECA, α for watchdog reset | 0.25 | 0.21 | 0.8× |
| FMECA, α for sensor drift | 0.20 | 0.15 | 0.7× |
| Testability, no-fault-found share | not estimated | 13% of reports | new |
The α column is the interesting one. Two of the three assumed ratios were close, which is the normal case and the reason mode ratios feel trustworthy. The third was out by a factor of six, and it is the one that dominated the year. A mode list is graded by its worst entry, not by its average, because the worst entry is what the failures are.
The loop's own health
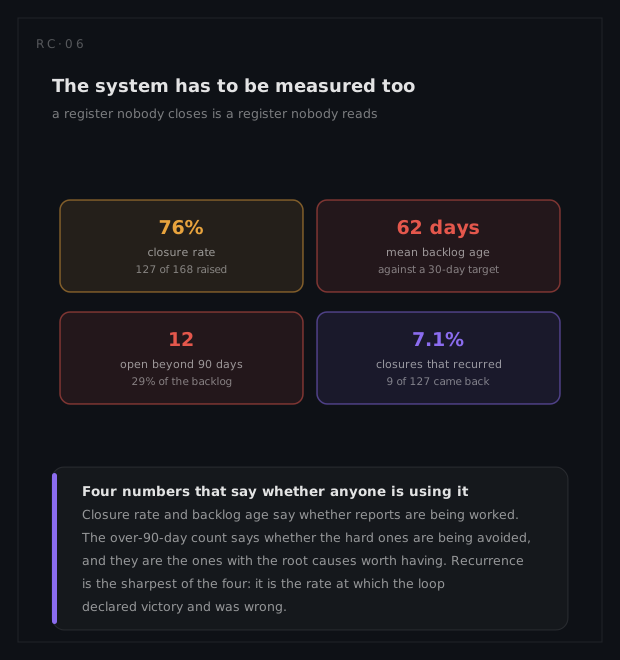
| Measure | This year |
|---|---|
| Closure rate | 127 of 168 = 76% |
| Mean backlog age | 62 days, against a 30-day target |
| Open beyond 90 days | 12, which is 29% of the backlog |
| Recurrence after closure | 9 of 127 = 7.1% |
Seventy-six per cent closure looks respectable and the two numbers beside it undercut it. The backlog is twice its target age, and the twelve reports older than 90 days are not a random sample: they are the ones whose cause is hard, which is where the remaining root causes live. And one closure in fourteen came back, meaning the action was wrong, incompletely applied, or closed without the evidence the seal retrofit was given.