

A FRACAS produces four things, and only the last two are worth the cost of running it. The rate and the Pareto are what everybody publishes; the corrections and the closure evidence are what the loop is for.
1. Observed rates, with the classification stated
| Figure | The example fleet |
|---|---|
| Reports per unit-hour | 47.9 per 10⁶ h |
| Relevant failures per unit-hour | 32.8 per 10⁶ h |
| Predicted | 24.0 per 10⁶ h |
| Field against prediction | 1.37× |
Never quote one without the classification rule beside it. Two organisations reporting 32.8 and 47.9 for identical hardware are not disagreeing about the equipment, and a rate published without its rule is unusable by anybody outside the programme that produced it. The comparison that carries information is the third row against the second: the ratio of observed to predicted is the grade on the prediction method, and it is the only calibration a company ever gets.
2. The cause distribution
Ranked, rate-weighted, and taken to a cause rather than a symptom. Two properties make it useful:
- It is weighted by failure rate, not by report count, wherever the population is mixed. Fifty reports from a hundred hot-climate units are not twice as important as twenty-five from a hundred temperate ones if the exposure differs.
- Each bar names something changeable. "Moisture ingress" ranks a symptom; the four causes underneath it rank work.
3. The corrections, each addressed to a document
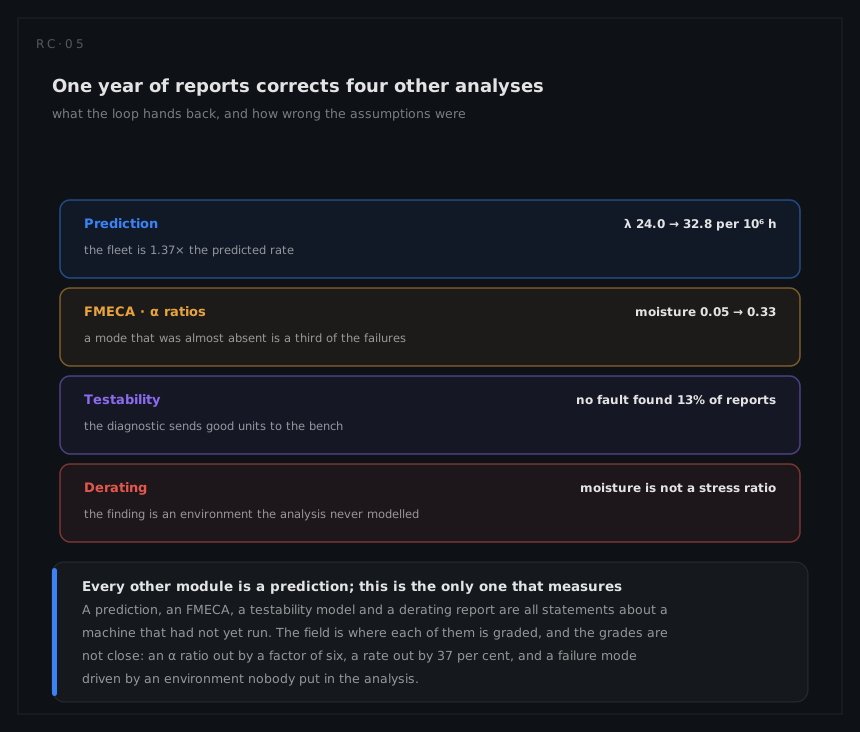
| Correction | To | What the correction looks like |
|---|---|---|
| Item failure rates | Prediction | A revision in either direction, item by item, wherever the accumulated exposure carries enough failures to support one |
Mode ratios α | FMECA | Most entries close, and the list graded by the one that is not |
| Missing modes | FMECA | The modes that need an environment nobody modelled |
| Detection and false alarm evidence | Testability | The no-fault-found share, measurable nowhere else |
| Task times | Maintainability | Longer than the prediction, which assumed an unhurried technician |
| Environment and stress reality | Derating | Stresses and exposures the analysis did not carry |
A programme that produces the first two outputs and not this one has bought a measurement and thrown away the calibration.
4. Closure evidence, per action
For each closed corrective action: the before-rate, the exposure since, the observed count, and the probability of that count under no change. Where the exposure was insufficient, the number of unit-hours that would have been needed, recorded and accepted.
μ = λ₀ · T → P(X ≤ k | μ)
An action closed without one of those two entries is an action closed on faith. Its cost is not zero: it is the 7 per cent recurrence rate on the example fleet, each recurrence being a failure the organisation already believed it had spent money to eliminate.
What the results do not support
- A comparison of failure rates between organisations whose relevance rules differ, which is most of them.
- A trend read from small counts. Three failures this quarter against one last quarter is noise; the Poisson arithmetic that tests a corrective action tests a trend claim just as well, and usually kills it. The question underneath the claim is a fair one, and it has instruments of its own: a trend test on the ordered failure times (the Laplace, or centroid, test) against a constant-rate null, or a power-law fit of cumulative failures against cumulative time, which is the reliability growth arithmetic applied to a fleet rather than to a test.
- A reliability figure from reports alone. Without operating time the data supports a Pareto chart and nothing else.
- Any statement about what was not reported. Under-reporting biases every rate downward and leaves no trace in the data; only an independent count, a warranty return stream or a maintenance record can bound it.
- A demonstrated MTBF. That is a designed test under MIL-HDBK-781 with a stated risk. Field data is observational, and it is more valuable for exactly that reason: it is the environment the equipment actually lives in.