

FRACAS fails as a process rather than as an analysis. The arithmetic in it is elementary; what is hard is that six steps have to happen to every one of several hundred reports, most of them by people whose main job is something else.
1. The classification rules come first
The rules for relevant, chargeable, primary, induced and no-fault-found, agreed and issued before the first report arrives. Written afterwards, every rule is a negotiation about a number somebody already has. This is also where the operating-time convention is fixed: what the clock is, who reads it, and how it is recorded for an item that failed while a fleet member sat idle.
2. Make reporting cheaper than not reporting
Under-reporting is the largest error in most systems and it is invisible: the rate looks better than it is, and nobody can tell by how much. The remedies are all practical, and none of them is a policy telling people to report:
| Friction | The fix |
|---|---|
| A form with forty fields | Six mandatory fields, the rest optional |
| Retyping what the system already knows | Item, configuration and operating hours filled from the fleet record |
| Reporting that leads nowhere visible | The reporter sees the disposition of their own report |
| A form only the depot can raise | Reporting from wherever the failure was seen |
3. Verify before analysing
Two questions, in order: did the item fail, and is it the item the report names? A confirmed no-fault-found is a finding in its own right and is routed to testability rather than dropped. Verification is also when the operating time and the configuration are checked against the fleet record, because that is the last moment anyone will care.
4. Analyse to a cause that can be acted on
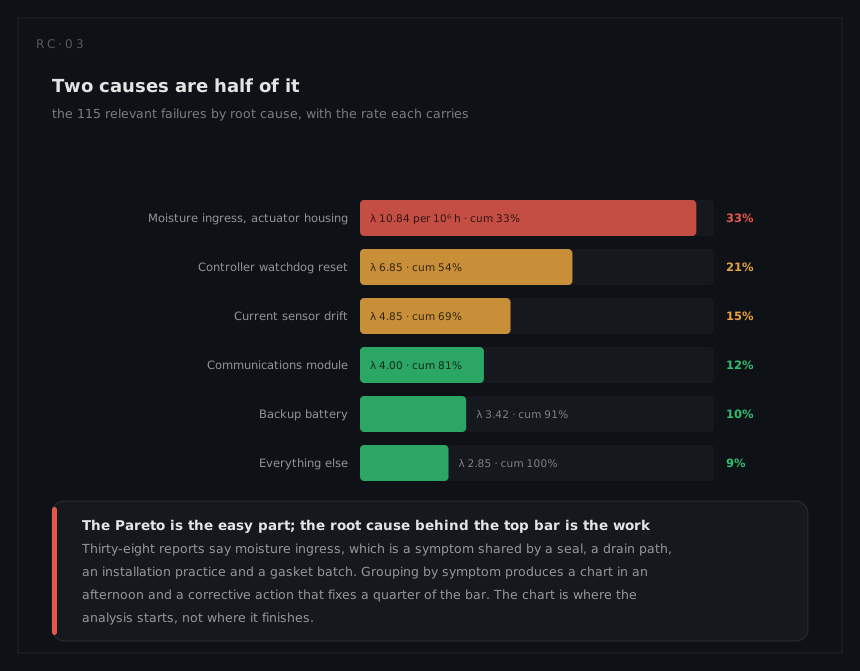
Group by symptom to find where to look, then work each group down to a cause. Two tests keep the step honest. Can somebody change it? A cause that names no design, process or document is a description. Would the change have prevented this report? If not, the cause is upstream of what was found.
Then ask the second question, about the escape: which analysis, test or review should have caught this, and why did it not. The answers accumulate into changes to the analyses themselves, and they are the reason a mature organisation's third product is better than its first.
5. Assign an action with an owner, a date and a scope
The scope matters as much as the action. A change applies to units built after a date, to a retrofit population, or to both, and the split is recorded at the time, because it is what makes step 7 possible. A retrofit that is rolled out in stages for logistics reasons has already created the control group; nobody has to design an experiment, only to write down which units got it and when.
6. Review what cannot be closed locally
A failure review board exists to do three things a single engineer cannot: decide relevance where it is contested, direct action across organisational boundaries, and accept the risk of not acting. Its usefulness is entirely a function of whether it has authority; a board that can only recommend produces minutes.
7. Prove the action, on the fleet
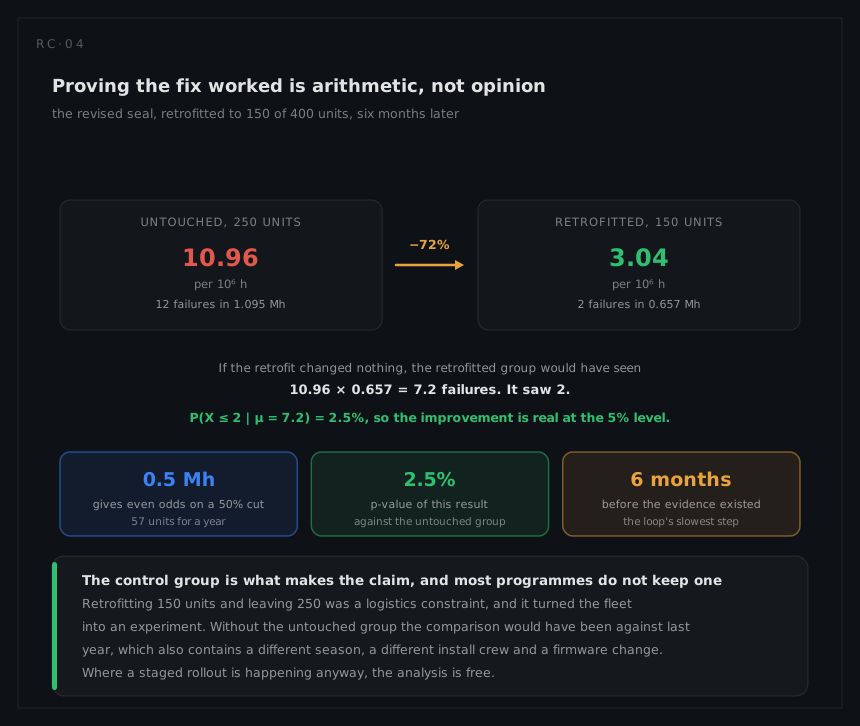
Compare the post-action rate with the pre-action rate or, better, with the untouched population over the same period:
μ = λ₀ · T and P(X ≤ k | μ)
and close the action only when the evidence exists or when the exposure needed for evidence has been computed and accepted as impractical. A closure justified by no recurrence to date is a schedule statement, not a result, and it is how recurrence rates get built.
8. Feed the corrections back, by name
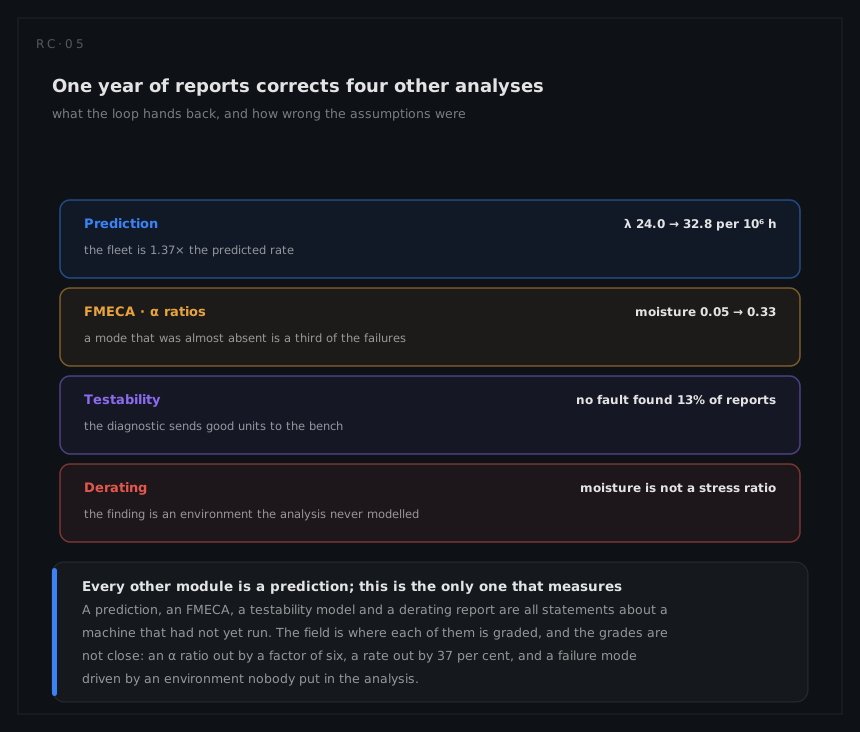
Each correction goes to a named document: the item rate to the prediction, the mode ratio to the FMECA worksheet, the no-fault-found share to the testability model, the task time to the maintainability library. A FRACAS whose output is a monthly slide has closed a reporting loop and left every design analysis exactly as wrong as it was.
9. Measure the loop itself
Closure rate, backlog age, count beyond the age threshold, and recurrence after closure, published where the same people who see the failure trends see them. A FRACAS is the only reliability activity whose own health can be measured continuously, and the four numbers cost nothing once the states exist.