

Nine steps, and the first four are data work. That ratio is the honest description of this analysis: the statistics take an afternoon and the dataset takes a fortnight.
1. Fix the question before the dataset
What decision is waiting on this? An interval, a life limit, a spares forecast, a warranty reserve, or an argument about whether a mode is age-related at all. The question decides which mode to analyse, which clock to use and how much precision is worth chasing.
2. Choose one failure mode
Not one item: one mode. Take it from the FMECA so the mode has a name everything else recognises. If the removal records cannot be sorted by mode, that is a finding about the FRACAS and it has to be fixed first, because no amount of statistics recovers a mixed population.
3. Choose the clock
Operating hours, cycles, landings, starts, kilometres, calendar time. The right clock is whatever the damage accumulates with. A thermal fatigue mode runs on cycles and a corrosion mode runs on calendar time in a particular environment, and fitting either against the wrong one produces a plot with no shape in it.
4. Assemble ages, including the survivors
For every unit of the population, the age it reached and whether it failed by this mode at that age. Three traps:
| Trap | What to do |
|---|---|
| Only the failures are in the record | Get the fleet's installed population and its ages; suspensions are most of the data |
| Repaired items counted from manufacture | Age since the last renewal of this mode |
| Units that entered part-worn | Record them as left-truncated rather than as new |
5. Plot it before you fit it
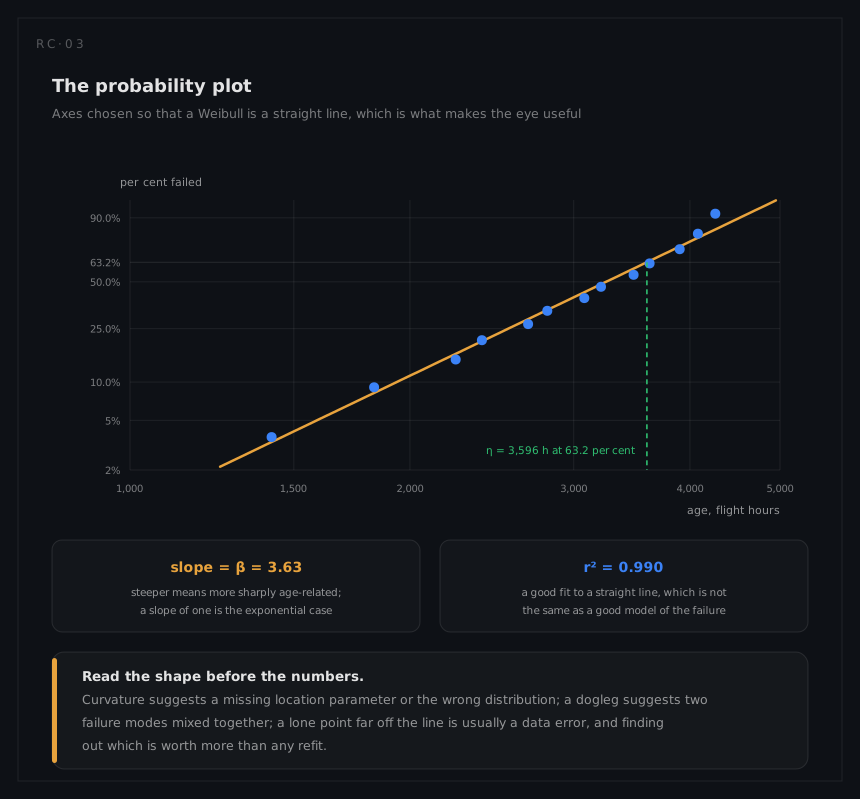
Read the shape: straight is Weibull, curved suggests a location parameter or another distribution, a dogleg suggests two modes, a point far off the line is usually a record to go and check.
6. Fit, both ways if it matters
Median rank regression with adjusted ranks for the suspensions, and maximum likelihood on the same data. Where they disagree materially, say so and say which you are using. Apply the small-sample correction to a maximum-likelihood β, and record the number of failures alongside the estimate, because the estimate means nothing without it.
7. Put an interval on it
A point estimate of β on a dozen failures is a number with a wide interval around it. Compute the interval, report it, and check whether the decision changes across it. If the answer flips between the bounds, the analysis has not settled the question, and saying so is the result.
8. Convert the fit into the answer the question needed
| If the question was | Report |
|---|---|
| Is this mode age-related? | β with its interval, and whether the interval includes 1 |
| What life limit? | The B-life at the tolerable failure fraction, with the fraction stated |
| What interval? | Conditional reliability over the candidate interval, at the ages the fleet is at |
| What rate for the model? | The hazard at a stated age, or averaged over the current fleet profile, with both stated |
| How many spares? | Expected failures over the period, integrating the hazard across the fleet's ages |
9. Hand it back, and mark what it invalidates
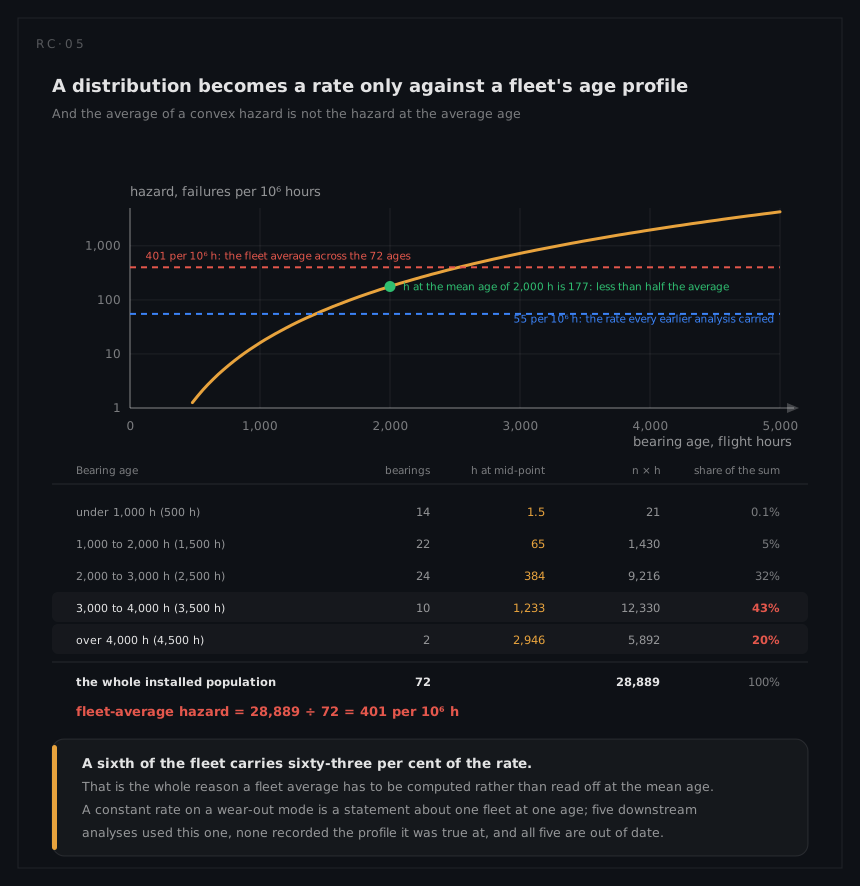
A fit with β above one invalidates, or at least dates, every constant rate for that mode: in the prediction, in the fault tree, in the repair level analysis, in the spares model. It also reopens the RCM decision, because an age-related mode makes scheduled restoration and discard applicable where they were not.
Then plan the refit. The tail of the distribution is the part with no data in it today, and the only thing that fills it is the fleet getting older.